
For LPP: Maximize \(z = 2x + 3y\) subject to the constraints
\(x + y \ge 2, x + 2y \ge 3, x \ge 0, y \ge 0\),
which of the following graph represents the feasible region of the above LPP as shaded portion?
Answer & explanation
Correct answer: option 4
The correct answer is Option (4) →
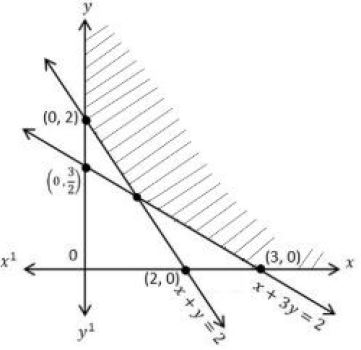
Each inequality is a half-plane. Its boundary line is drawn through the two intercepts, and the origin test shows which side is shaded.
For \(x + y \ge 2\), the boundary line \(x + y = 2\) passes through (2, 0) and (0, 2). At the origin:
\(0 + 0 = 0 \lt 2\)
The origin does not satisfy it, so this half-plane lies on the side of the line away from the origin.
For \(x + 2y \ge 3\), the boundary line \(x + 2y = 3\) passes through (3, 0) and \(\left(0, \frac{3}{2}\right)\). At the origin:
\(0 + 0 = 0 \lt 3\)
Again the half-plane lies away from the origin. With \(x \ge 0, y \ge 0\), the region is in the first quadrant.
The two lines meet where
\((x + 2y) - (x + y) = 3 - 2\)
\(y = 1,\quad x = 1\)
So the feasible region is the unbounded region of the first quadrant on or above both lines, with corners (0, 2), (1, 1) and (3, 0). Option (4) shades this region.
Why the other options are incorrect
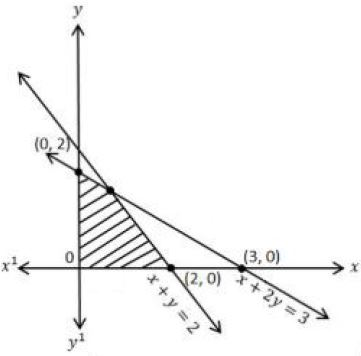
Option (1) — Incorrect. It shades a bounded region next to the origin, but the origin does not satisfy \(x + y \ge 2\).
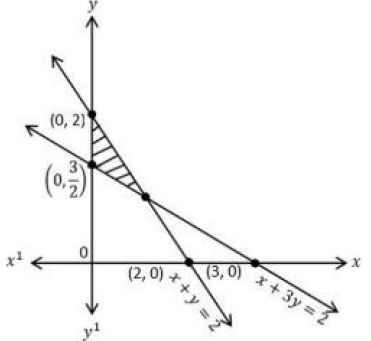
Option (2) — Incorrect. It shades the triangle with corners (0, 2), \(\left(0, \frac{3}{2}\right)\) and (1, 1), which lies below \(x + y = 2\). For example, (0.2, 1.6) in it gives \(x + y = 1.8 \lt 2\).
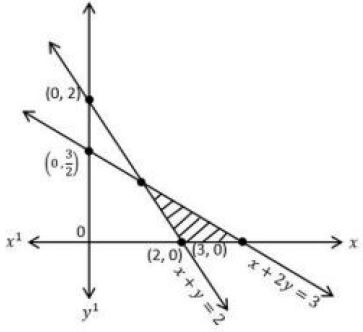
Option (3) — Incorrect. It shades the triangle with corners (1, 1), (2, 0) and (3, 0), which lies below \(x + 2y = 3\). For example, (2, 0.25) in it gives \(x + 2y = 2.5 \lt 3\).
Note: It seems that there is a mistake in the original NTA paper, which labels the line through \(\left(0, \frac{3}{2}\right)\) and (3, 0) in graphs 2 and 4 as \(x + 3y = 2\) when it should read \(x + 2y = 3\). The question can still be solved because the intercepts marked on that line, \(\left(0, \frac{3}{2}\right)\) and (3, 0), fit \(x + 2y = 3\), and graph 4 shades the correct region.