CUET Preparation Today
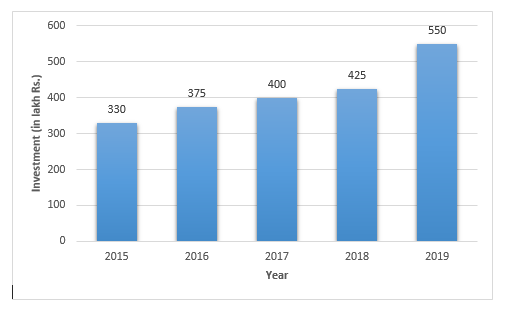
The following bar graph shows the amount (in lakh Rs.) investment by a company in purchasing raw materials over the years 2015 to 2019. By how much percent the company increase its investment on raw materials in 2019, as compared to 2015 ?
|
33.33% 66.66% 11.66% 20% |
66.66% |
Investment in 2019 = 550 Investment in 2015 = 330 Percentage increase in investment = \(\frac{550 - 330 }{330}\) × 100 = \(\frac{220 }{330}\) × 100 = 66.66% |