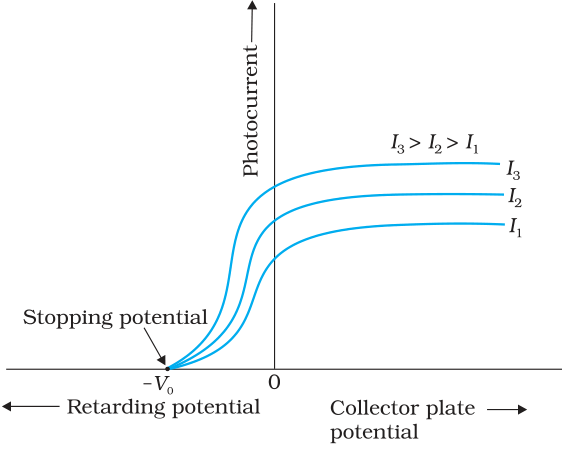
The correct curve between stopping potential (\( V_0 \)) and intensity of incident radiation (I) at constant frequency is:
Answer & explanation
Correct answer: option 4
The correct answer is Option (4)
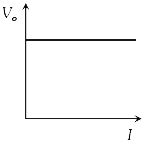
The stopping potential is fixed by the maximum kinetic energy of the photoelectrons, and this is given by Einstein's equation, which has no intensity in it.
\( \displaystyle eV_0 = K_{\max} = h\nu - \phi_0 \Rightarrow V_0 = \frac{h\nu - \phi_0}{e} \)
At constant frequency the right-hand side is a constant, so \( V_0 \) stays the same whatever the intensity: the graph is a horizontal straight line parallel to the I axis.
Why the other options are incorrect
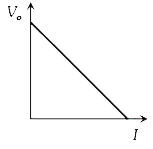
Option (1) — Incorrect. The stopping potential does not fall as the intensity rises.
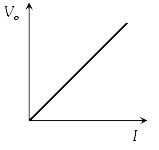
Option (2) — Incorrect. A straight line rising from the origin is the graph of photocurrent against intensity, not of stopping potential.
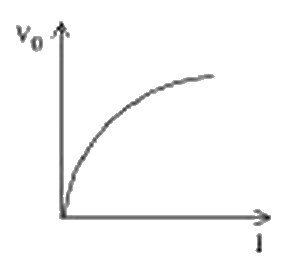
Option (3) — Incorrect. The stopping potential does not increase, or saturate, with intensity; it does not change at all.
NCERT (2026-27):
Effect of Potential on Photoelectric Current – “… But the stopping potential remains the same as that for the incident radiation of intensity I1, as shown graphically in Fig. 11.3. Thus, for a given frequency of the incident radiation, the stopping potential is independent of its intensity.”