
Resistivity (p) vs temperature graphs of some materials are given below. The graph corresponds to a semiconductor is:
Answer & explanation
Correct answer: option 3
The correct answer is option (3) : 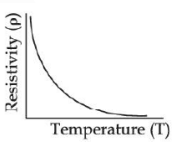
For semiconductor, resistivity decreases with increase in, temperature.