
The graph shows variation of current (I) with time (t) in an inductance coil.
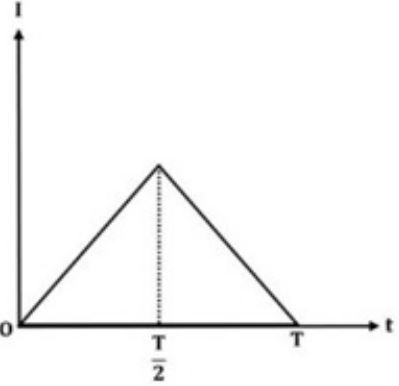
The graph that depicts the correct variation of induced emf produced in the coil with time is:
Answer & explanation
Correct answer: option 4
The correct answer is Option (4)
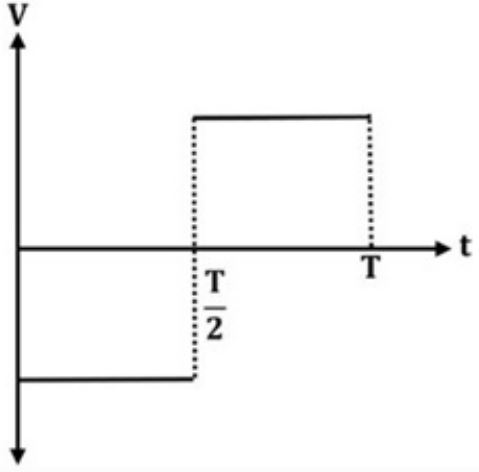
The self-induced emf in a coil is \( e = -L\,dI/dt \), so the emf graph is fixed by the slope of the current-time graph, with the sign reversed.
From \( 0 \) to \( T/2 \) the current rises at a constant rate: \( dI/dt \) is constant and positive, so \( e \) is constant and negative.
From \( T/2 \) to \( T \) the current falls at the same constant rate: \( dI/dt \) is constant and negative, so \( e \) is constant and positive, of the same size.
So the emf is a rectangular graph: a negative constant for the first half and an equal positive constant for the second half.
Why the other options are incorrect
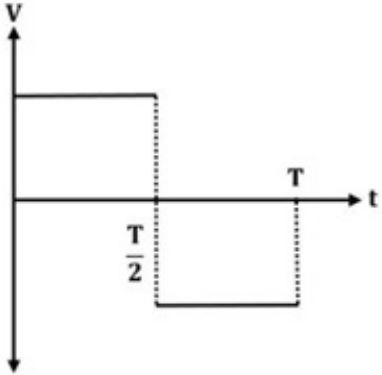
Option (1) — Incorrect. This has the right shape but the opposite sign. It plots \( +L\,dI/dt \), leaving out the minus sign of Lenz's law.
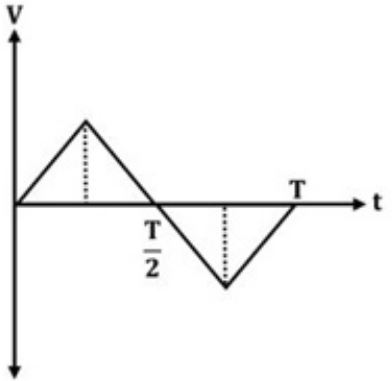
Option (2) — Incorrect. The emf follows the slope of the current, which is constant in each half, so the emf cannot rise and fall linearly.
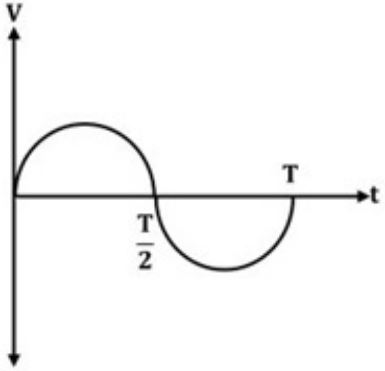
Option (3) — Incorrect. A constant slope cannot give a curved, sinusoidal emf.
NCERT (2026-27):
Self-Inductance – “… When the current is varied, the flux linked with the coil also changes and an emf is induced in the coil. Using Eq. (6.13), the induced emf is given by
\( \displaystyle \varepsilon = -\frac{d(N\Phi_B)}{dt} \)
\( \displaystyle \varepsilon = -L\frac{dI}{dt} \qquad (6.14) \)
Thus, the self-induced emf always opposes any change (increase or decrease) of current in the coil.”