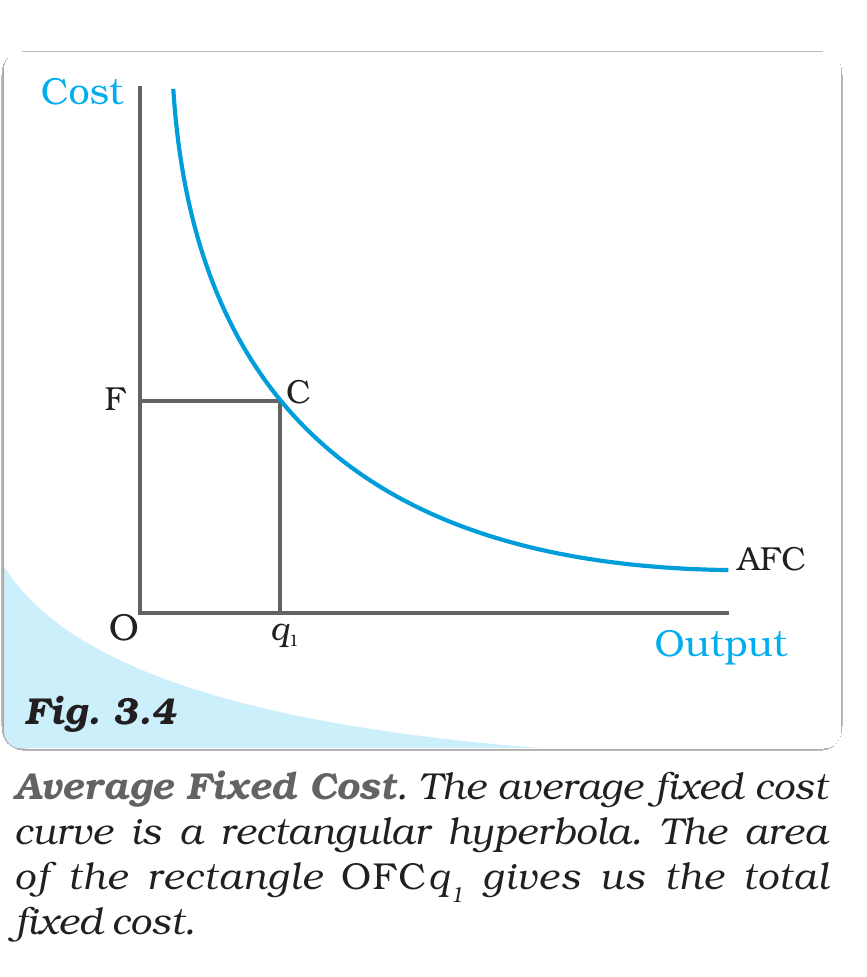
Average fixed cost curve is actually a ................curve:
Answer & explanation
Correct answer: option 1
The correct answer is Option (1) → Rectangular Hyperbola Curve.
Average fixed cost (AFC) is total fixed cost (TFC) divided by output, q. Multiply any q by its AFC and you always get the same constant, TFC. A curve with this property is a rectangular hyperbola.
TFC stays the same at every output, so AFC keeps falling as output rises. When output is very small, AFC is very large. As output grows without limit, AFC moves towards zero. The area of every rectangle under the curve equals TFC.
The ‘U’-shaped curves are those of average variable cost, short run average cost and short run marginal cost. AFC has no rising part.
Note: A same/similar question was asked in CUET (UG) in the papers below.
| 2026 | 2025 | 2024 | 2023 | 2022 |
| – | 13-05 S1* 27-05 S2 29-05 S2* 02-06 S1* 03-06 S2* | – | – | – |
* A similar question.
NCERT (2026-27): “3.7.1 Short Run Costs … AFC is the ratio of TFC to q. TFC is a constant. Therefore, as q increases, AFC decreases. When output is very close to zero, AFC is arbitrarily large, and as output moves towards infinity, AFC moves towards zero. AFC curve is, in fact, a rectangular hyperbola. If we multiply any value q of output with its corresponding AFC, we always get a constant, namely TFC.… …Figure 3.4 shows the shape of average fixed cost curve for a typical firm. We measure output along the horizontal axis and AFC along the vertical axis.…”
|