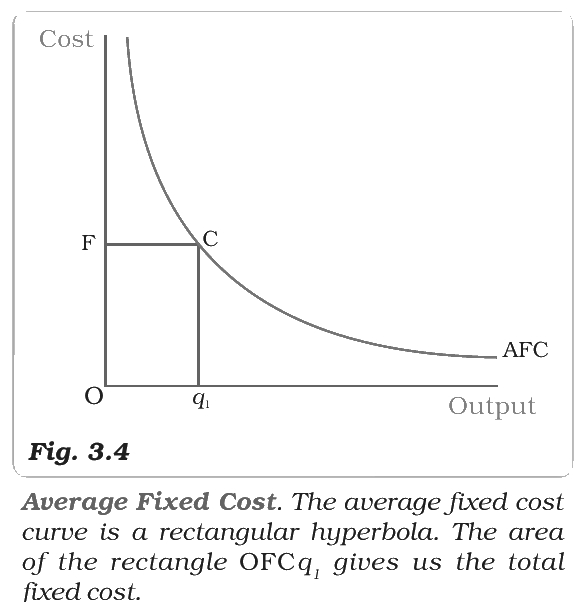
In the figure below, output is on the X-axis and cost is on the Y-axis.
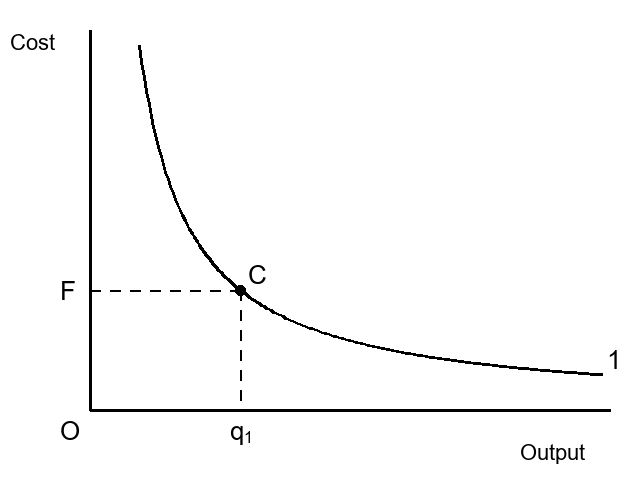
What are curve 1 and the area of the rectangle OFCq1?
Answer & explanation
Correct answer: option 1
The correct answer is Option (1) → Curve 1 is the AFC curve; the area OFCq1 is total fixed cost
Curve 1 falls steeply at first and then flattens, getting ever closer to the output axis. This is the AFC curve, a rectangular hyperbola: TFC is fixed, so TFC divided by a larger output keeps getting smaller.
The rectangle OFCq1 has height AFC (OF) and width output (Oq1). AFC × output = total fixed cost.
NCERT (2026-27): “Shapes of the Short Run Cost Curves … AFC is the ratio of TFC to q. TFC is a constant. Therefore, as q increases, AFC decreases. When output is very close to zero, AFC is arbitrarily large, and as output moves towards infinity, AFC moves towards zero. AFC curve is, in fact, a rectangular hyperbola. If we multiply any value q of output with its corresponding AFC, we always get a constant, namely TFC.” “Shapes of the Short Run Cost Curves … Figure 3.4 shows the shape of average fixed cost curve for a typical firm. We measure output along the horizontal axis and AFC along the vertical axis. At q1 level of output, we get the corresponding average fixed cost at F. The TFC can be calculated as TFC = AFC × quantity = OF × Oq1 = the area of the rectangle OFCq1”
|