CUET Preparation Today
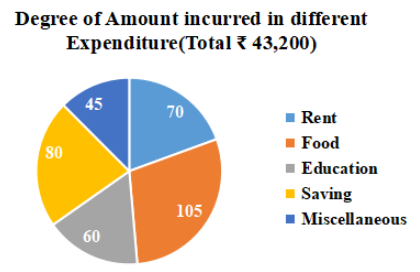
The given Pie-Chart shows the degree wise breakup of expenditure of a family in a month. Total income of a family is ₹43,200.
Expenditure on food is what percent more than expenditure on rent? |
$\frac{200}{3} \%$ $\frac{100}{3} \%$ 50% $\frac{50}{3} \%$ |
50% |
Required percentage = \(\frac{105 - 70 }{70}\) × 100 = \(\frac{35}{70}\) × 100 = 50% |