CUETMOCK
  • Pricing
  • Mentors
Log inStart freeStart free mocks→

First test, then trust

Try a free CUET mock test.

Join 5,00,000+ students who rehearsed exam day on the exact NTA screen before sitting CUET. On the web and on Android.

Start free mocks →Get the Android app
CUETMOCK

India's #1 CUET Mock Test Platform. Original NCERT-based questions on the exact NTA exam screen — trusted by 5,00,000+ students since CUET 2022.

Get it onGoogle PlayScan to download the CUETMOCK app

Mock tests

  • CUET mock test series
  • Browse all papers
  • Commerce mocks
  • Humanities (Arts) mocks
  • Science mocks
  • Languages & GAT mocks
  • Free practice questions
  • Pricing

Resources

  • CUET exam guide
  • CUET syllabus
  • Universities accepting CUET
  • Expert blogs
  • News & notifications
  • Webinars & counselling
  • CUET score calculator
  • How we estimate your rank
  • FAQs

Company

  • About us
  • Our leadership & team
  • Our toppers
  • Mentors
  • For schools
  • Contact us
  • Terms
  • Privacy
  • Refund policy

Talk to us

+91 7696 6630 56info@cuetmock.comWhatsApp us

Our other platforms

  • JEE Mock — For IIT-JEE aspirants
  • NEET Mock — For NEET aspirants

Newsletter

Exam updates, study material and offers — no spam.

© 2026 NYC Ventures Pvt. Ltd.

701-702, Royal Business Park, Zirakpur, Punjab - 140603

  • Terms of use
  • Privacy policy
  • Refund policy
  • Contact us

iCUETMOCK is an independent preparation platform, not affiliated with the National Testing Agency (NTA). Always check exam details on the official NTA website.

  • Home
  • Mock tests
  • CUET guide
  • Pricing
  • Log in
Home/Practice questions/Accountancy Part C
Accountancy Part CGraphs and Charts for Business Data

Which chart element details the data values and categories below the…

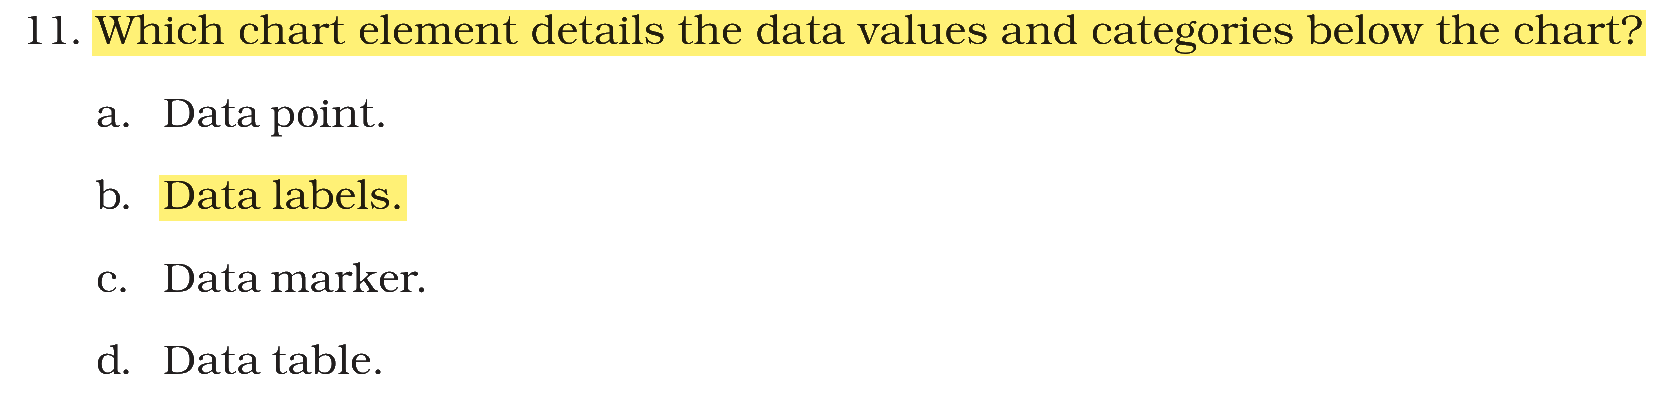
Which chart element details the data values and categories below the chart?

Answer & explanation+

Correct answer: option 2

The correct answer is Option (2) → Data labels

Every value plotted on a chart is a data point, drawn as a bar, column, line or slice called a data marker. A data label is the text attached to a data marker that gives the details of that data point, such as its value and its category, so the reader does not have to estimate them from the axes. That is the element that details the data values and categories of the chart.

Why the other options are incorrect

  • Option (1) Data point. — Incorrect. A data point is the plotted value itself; it is what a label describes, not the element that gives the details.

  • Option (3) Data marker. — Incorrect. A data marker is the bar, column, line or slice that represents a data point; it shows the size of a value but carries no written details.

  • Option (4) Data table. — Incorrect. A data table does sit below the chart, but it only repeats the worksheet figures as a separate grid. It does not attach the details to each data point the way data labels do, so the words “below the chart” alone do not make it the answer; the answer given by NTA is Data labels.

NCERT (2026-27 edition):
Elements of a Chart/Graph

Extract from the NCERT textbook

NCERT (2026-27 edition):
Multiple Choice Questions

Extract from the NCERT textbook

NCERT (2026-27 edition):
Answers

Extract from the NCERT textbook

Advertisement

Practise more on Graphs and Charts for Business Data

Chapter-wise mocks on the real NTA exam screen, with solutions and your rank. Your first mocks are free.

Start free mocks →

Advertisement

Next questions

  1. What does growth and development refer to ?Geography · Fundamentals of Human Geography: Human Development
  2. Identify the steps involved in the production and manufacturing of Bidi as an example of Home-based work A. Auctioning of leaves to factory…Sociology · Social Change and Development in India: Change and Development in industrial Society
  3. Unmetalled roads and lack of modern network does not pose serious difficulties in providing which of the following?Geography · Fundamentals of Human Geography: Human Settlements
  4. Where is this painting in the collection?Fine Arts · The Pahari Schools of Painting
  5. Identify the odd one out among the following, with reference to the appendices of the Fifth Report of 1813.History · Modern India: Colonialism and the Countryside
  6. Which artists used photorealism to comment on communal violence and advancement in Indian cities in their work?Fine Arts · The Modern Indian Art
  7. What is the coordination number of Fe in [Fe(CO)_5] and [Fe(C_2O_4)_3]^3- respectively?Chemistry · Inorganic: Coordination Compounds
  8. When did the federation of West Indies came into being?Political Science · Federalism
  9. Read the following statements regarding antibiotics. I. Antibiotics are chemical substances produced by certain microorganisms that can inh…Biology · Microbes in Human Welfare
  10. Examine the four jumbled sentences. Out of the given options, pick the one that gives their correct order. A. What can we do to avoid anger…English · Arrange in Meaningful Sequence