CUET Preparation Today
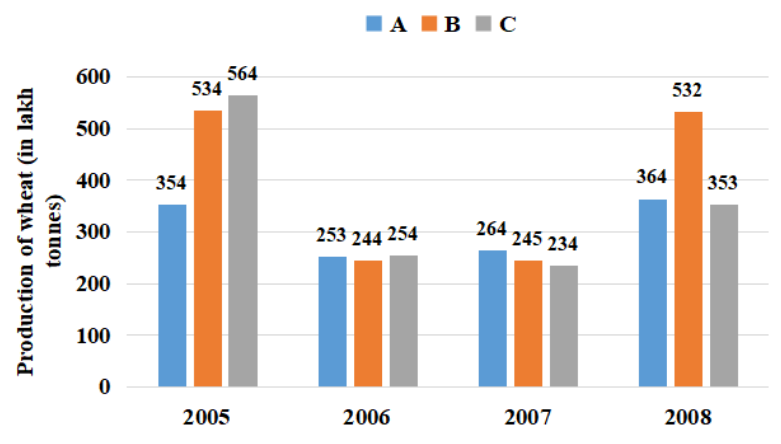
The following graph shows the production of wheat (in lakh tonnes) by states A, B and C in four consecutive years.
Find the year which shows the maximum aggregate production of wheat. |
2005 2008 2006 2007 |
2005 |
Production of wheat in 2005 = 354 + 534 + 564 = 1452 Production of wheat in 2006 = 253 + 244 + 254 = 751 Production of wheat in 2007 = 264 + 245 + 234 = 743 Production of wheat in 2008 = 364 + 532 + 353 = 1249 So , Maximum Production of wheat is in 2005. Ans :- 2005 |