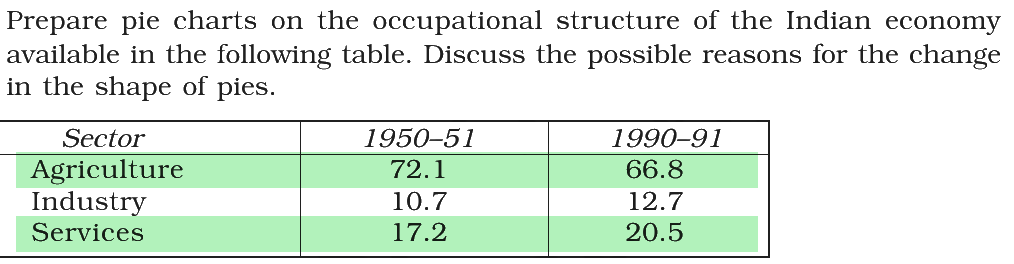
The table gives the occupational structure of India (percentage share of workers):
| Sector | 1950–51 | 1990–91 |
|---|---|---|
| Agriculture | 72.1 | 66.8 |
| Industry | 10.7 | 12.7 |
| Services | 17.2 | 20.5 |
Which of the following is NOT correct as per the table?
Answer & explanation
Correct answer: option 4
The correct answer is Option (4) → By 1990–91, services had more workers than agriculture.
In 1990–91, agriculture still had 66.8 per cent of workers and services only 20.5 per cent. So most workers were still in agriculture.
Option (1) The share of agriculture in workers fell between the two years. — True. It fell from 72.1 to 66.8 per cent.
Option (2) The share of industry in workers rose by 2 percentage points. — True. 12.7 − 10.7 = 2.0 percentage points.
Option (3) Services had a larger share of workers than industry in both years. — True. 17.2 against 10.7, and 20.5 against 12.7.
Option (4) By 1990–91, services had more workers than agriculture. — False. Services had 20.5 per cent, far below agriculture’s 66.8 per cent.
Note: A ‘Work These Out’ activity can hide a whole data table. Read the activity boxes too, and look at their numbers.
NCERT (2026-27): |