CUET Preparation Today
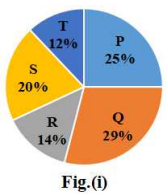
Study the given pie charts and answer the question that follows. The pie charts show the distribution of students of graduate and postgraduate levels in five different institutes P, Q, R, S and T in a town. (i) Total number of students of graduate level in five different institutes = 12400
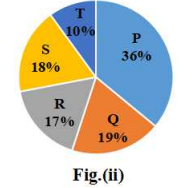
(ii) Total number of students of post graduate level in five different institutes = 8000
The ratio of the number of students of graduate level in Institutes P and S together to that of post graduate level in institutes P and is: |
33 : 25 31 : 23 28 : 25 31 : 24 |
31 : 24 |
Number of graduate students in P & S : Number of post graduated studnets in P \(\frac{25+20 }{100}\) × 12400 : \(\frac{36 }{100}\) × 8000 \(\frac{9 }{20}\) × 12400 : \(\frac{9 }{25}\) × 8000 31 : 24 |