CUET Preparation Today
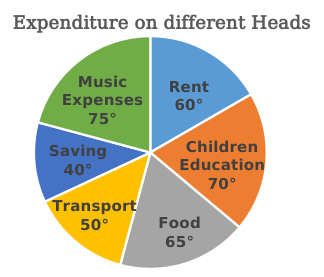
Monthly expenditure of a family on different heads is shown in the following pie chart. What is the percentage of family earnings spent on rent?
|
$15 \frac{3}{4}$ $16 \frac{2}{3}$ $16 \frac{1}{3}$ 15 |
$16 \frac{2}{3}$ |
Percentage of family earnings spent on rent = \(\frac{60}{360}\) × 100 = 16\(\frac{2}{3}\) |