The given graph is for :
Answer & explanation
Correct answer: option 2
The correct answer is Option (2) → Instantaneous rate of reaction
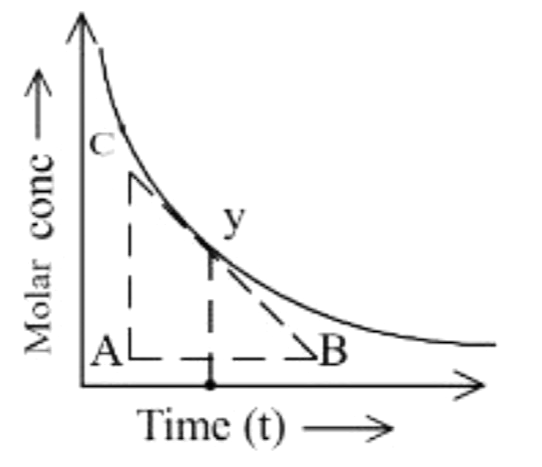
The graph plots the molar concentration of a reactant against time. At the point y on the curve a tangent is drawn (the dashed line CB). The slope of this tangent gives the rate at that one instant:
rinst = −d[R]/dt = −(slope of the tangent at y)
This is the instantaneous rate, the average rate taken over an infinitely small time interval.
Why the other options are incorrect
Option (1) Average rate of reaction — Incorrect. The average rate is −Δ[R]/Δt between two points on the curve (a chord, not a tangent at one point).
Option (3) Initial rate for product — Incorrect. The curve falls with time, so it is for a reactant, and the tangent is drawn at y, not at t = 0.
Option (4) Final rate for reactant — Incorrect. The tangent is at an intermediate point y, not at the end of the reaction, where the slope would be almost zero.
NCERT (2026-27 edition):
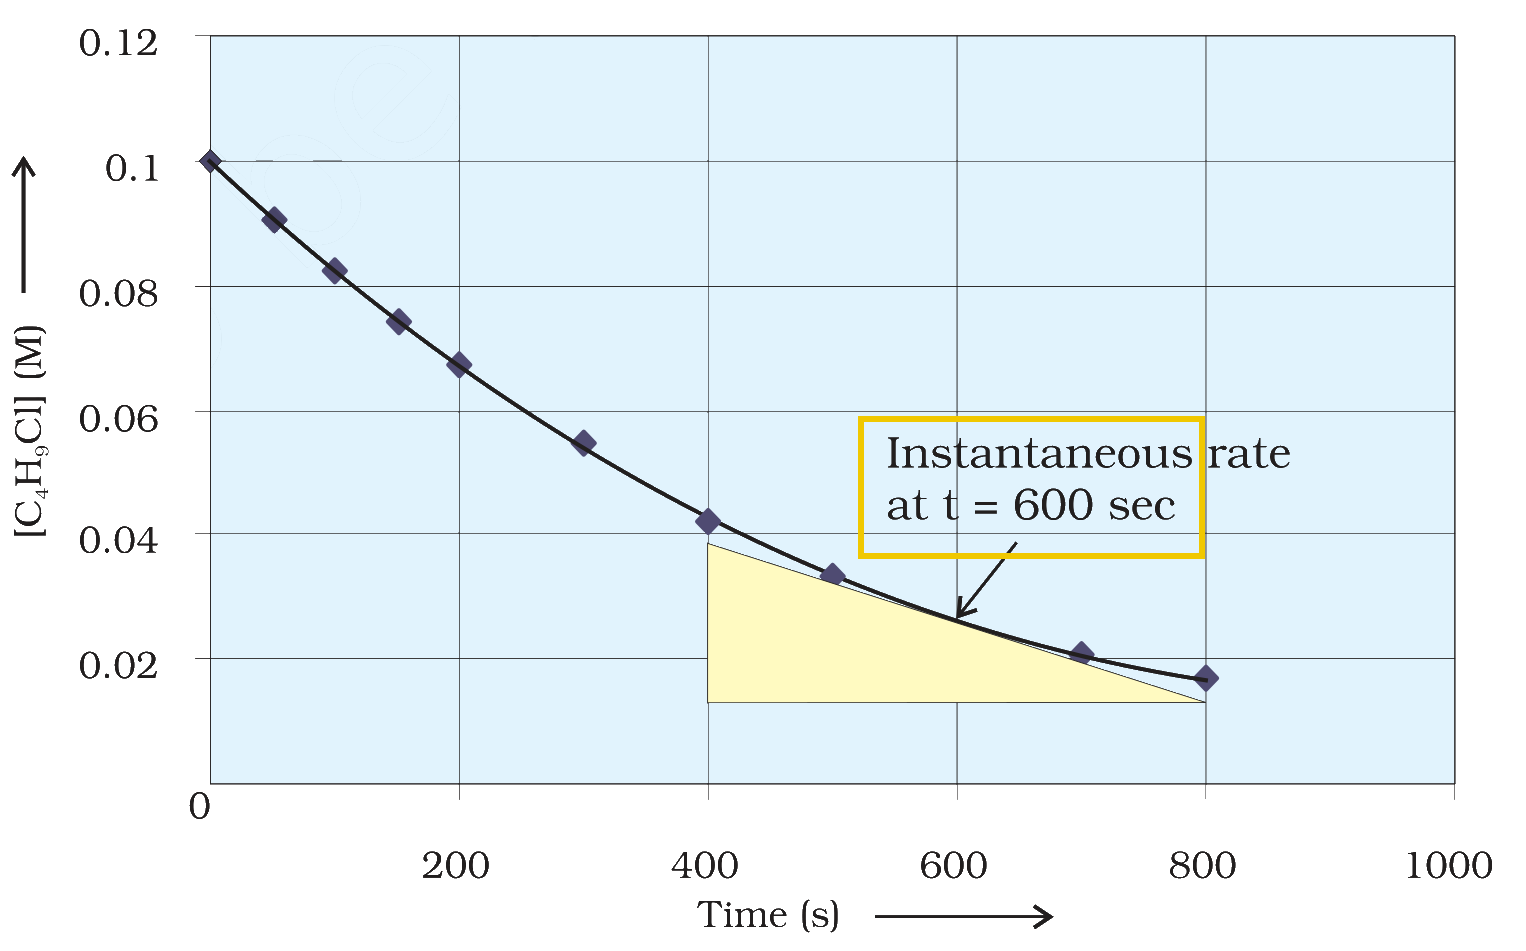
Rate of a Chemical Reaction – “… It can be determined graphically by drawing a tangent at time t on either of the curves for concentration of R and P vs time t and calculating its slope (Fig. 3.1). … A tangent is drawn that touches the curve at t = 600 s (Fig. 3.2). The slope of this tangent gives the instantaneous rate.”