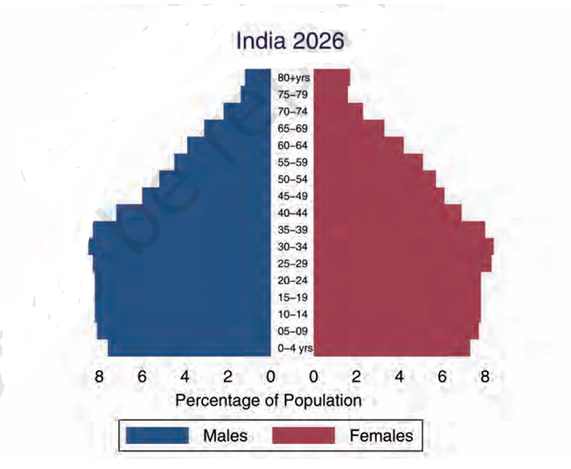
The following figure shows Age Group ‘pyramid’ of India of a particular year. To which year this pyramid belongs to?
Answer & explanation
Correct answer: option 4
The correct answer is Option 4: 2026
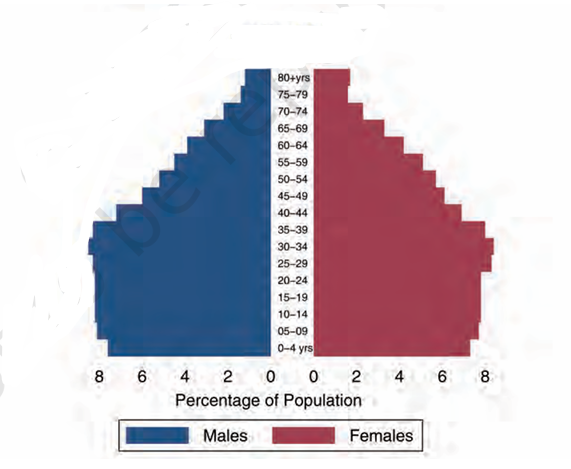
The age pyramid shown has a relatively narrower base and a bulge in the working-age groups (roughly 20–39 years). This indicates:
- Lower birth rates compared to earlier decades.
- A smaller proportion of children in the population.
- A larger proportion of people in the working-age groups.
- Increasing life expectancy and a gradual ageing of the population.
If the pyramid belonged to 1951 or 1971, the base would be much broader because of higher birth rates and a larger share of young children. 1991 would still show a more expansive base than the one shown here.
The shape shown is characteristic of the projected age structure for 2026, where fertility has declined and the population contains a larger proportion of adults and elderly persons.