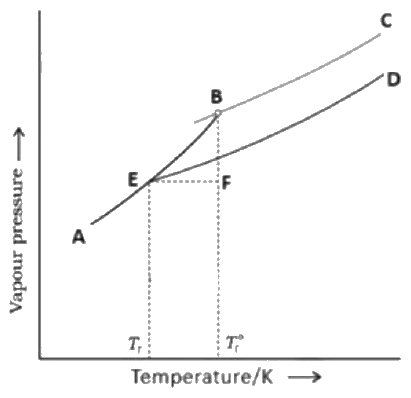
Match the various curves from List-I with the type of solutions/change in List-II with reference to the given figure.
| Curve | Solution/Change |
| (A) A-B | (I) Liquid solvent |
| (B) B-C | (II) Solution |
| (C) E-D | (III) Depression in freezing point of solvent in solution |
| (D) E-F | (IV) Frozen solvent |
Choose the correct answer from the options given below:
Answer & explanation
Correct answer: option 2
The correct answer is Option (2) → (A) - (IV), (B) - (I), (C) - (II), (D) - (III)
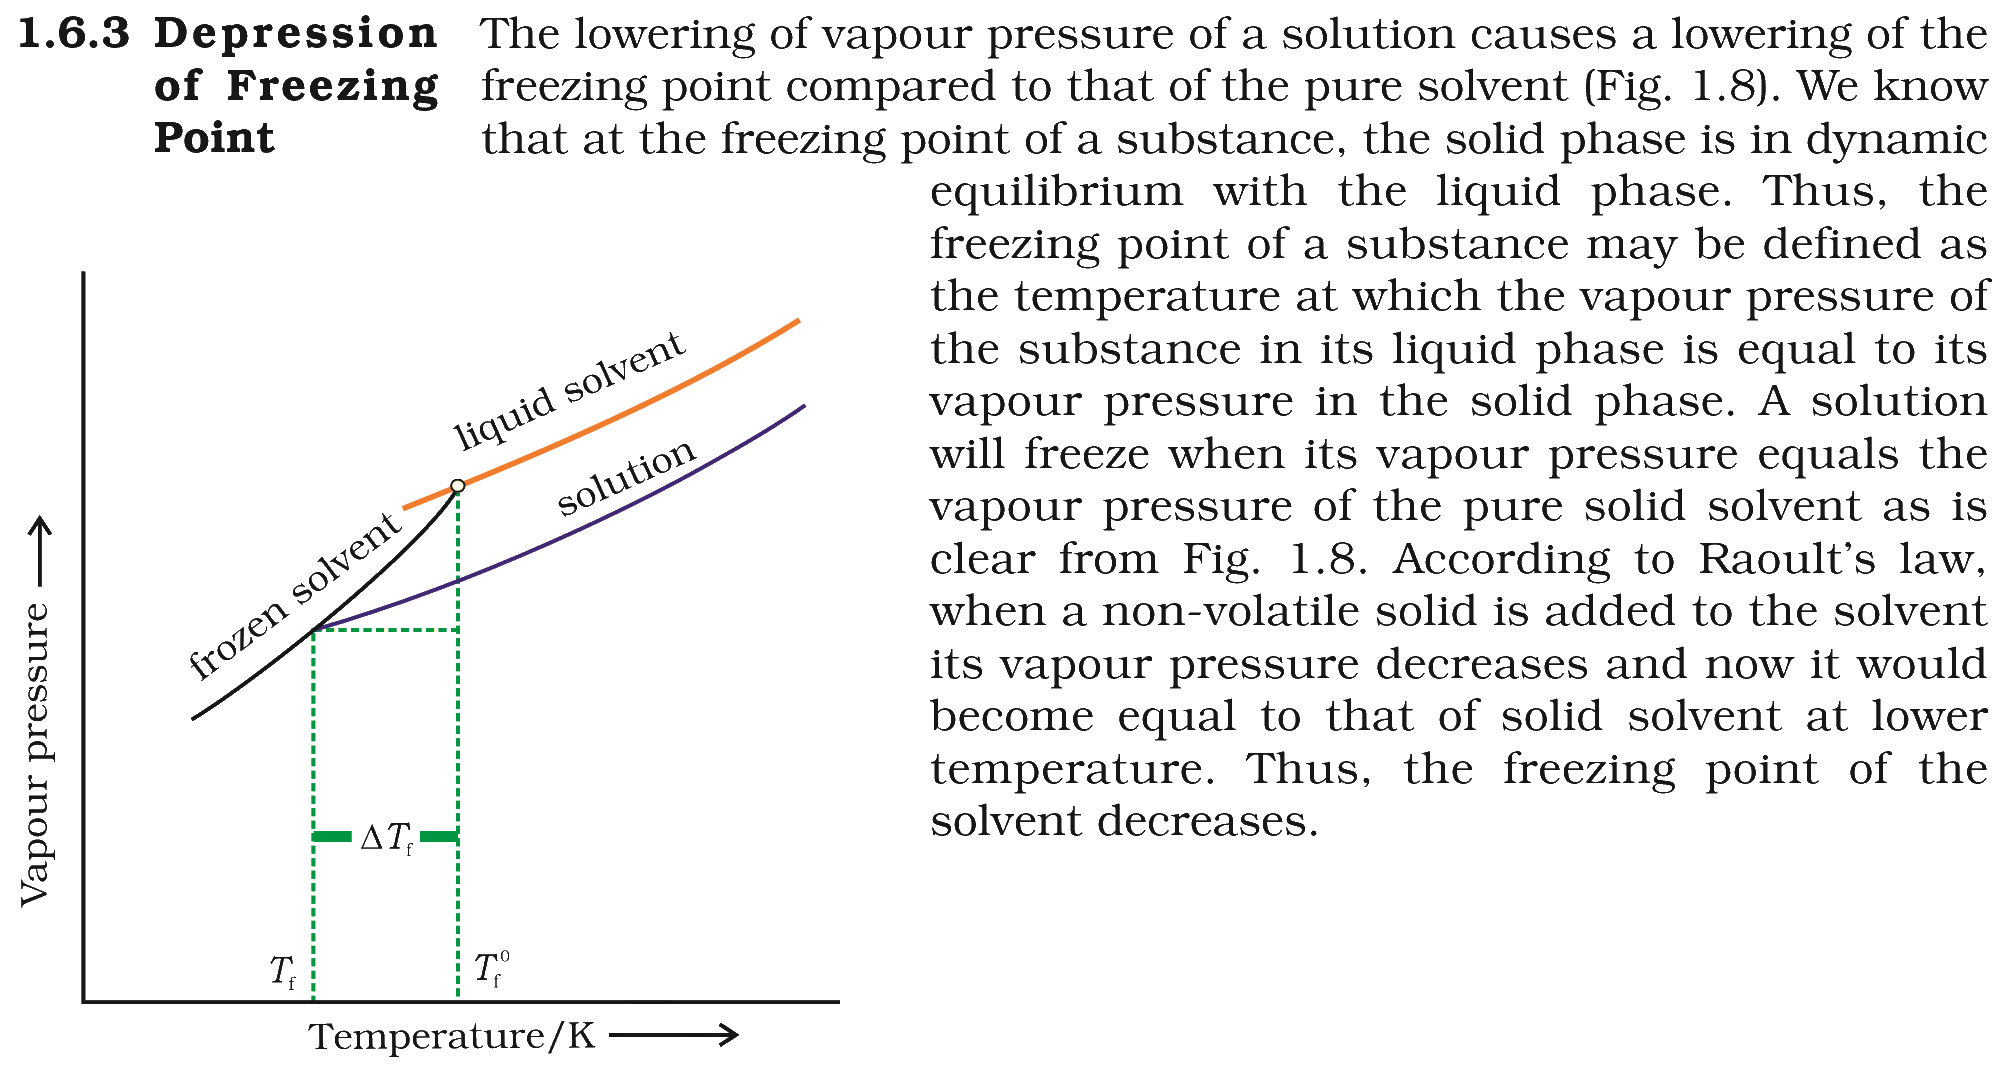
In the book’s vapour pressure–temperature diagram, the solution curve lies below the pure solvent curve, so it meets the solid curve at a lower temperature:
(A) A-B — This matches (IV) Frozen solvent. This is the vapour pressure curve of the solid solvent, which falls steeply as the temperature decreases.
(B) B-C — This matches (I) Liquid solvent. This curve begins at B, where the pure liquid solvent is in equilibrium with its solid, so B is at the freezing point of the pure solvent, Tf°.
(C) E-D — This matches (II) Solution. The solution has a lower vapour pressure than the pure solvent at every temperature, so its curve lies below B-C and meets the solid curve at E, the freezing point of the solution, Tf.
(D) E-F — This matches (III) Depression in freezing point of solvent in solution. E-F spans the gap between Tf and Tf°, which is the depression in freezing point.
\( \displaystyle \Delta T_f=T_f^{\circ}-T_f=K_f\,m \)
Shortcut: The pair (A)–(IV) appears in Options (2) and (4), and (C)–(II) then leaves only Option (2).
NCERT (2026-27 edition):
Depression of Freezing Point