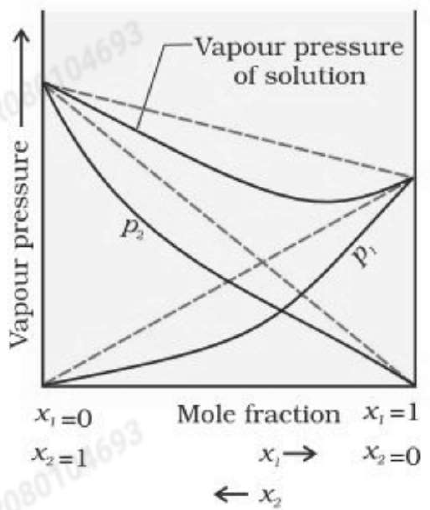
The graph given below indicates which of the following phenomena/ examples:
(A) Positive deviation from Raoult’s law.
(B) Negative deviation from Raoult’s law.
(C) Chloroform and acetone.
(D) Phenol and aniline.
Choose the correct answer from the options given below:
Answer & explanation
Correct answer: option 4
The correct answer is Option (4) → (B), (C) and (D) only
An ideal solution obeys Raoult’s law over the whole range of composition, so its vapour pressure lies on the straight (dashed) line joining the vapour pressures of the pure components. Real solutions deviate from this line:
Positive deviation: A–B attractions are weaker than A–A and B–B attractions, molecules escape more easily, and the vapour pressure is higher than the ideal line (e.g. ethanol + acetone, carbon disulphide + acetone).
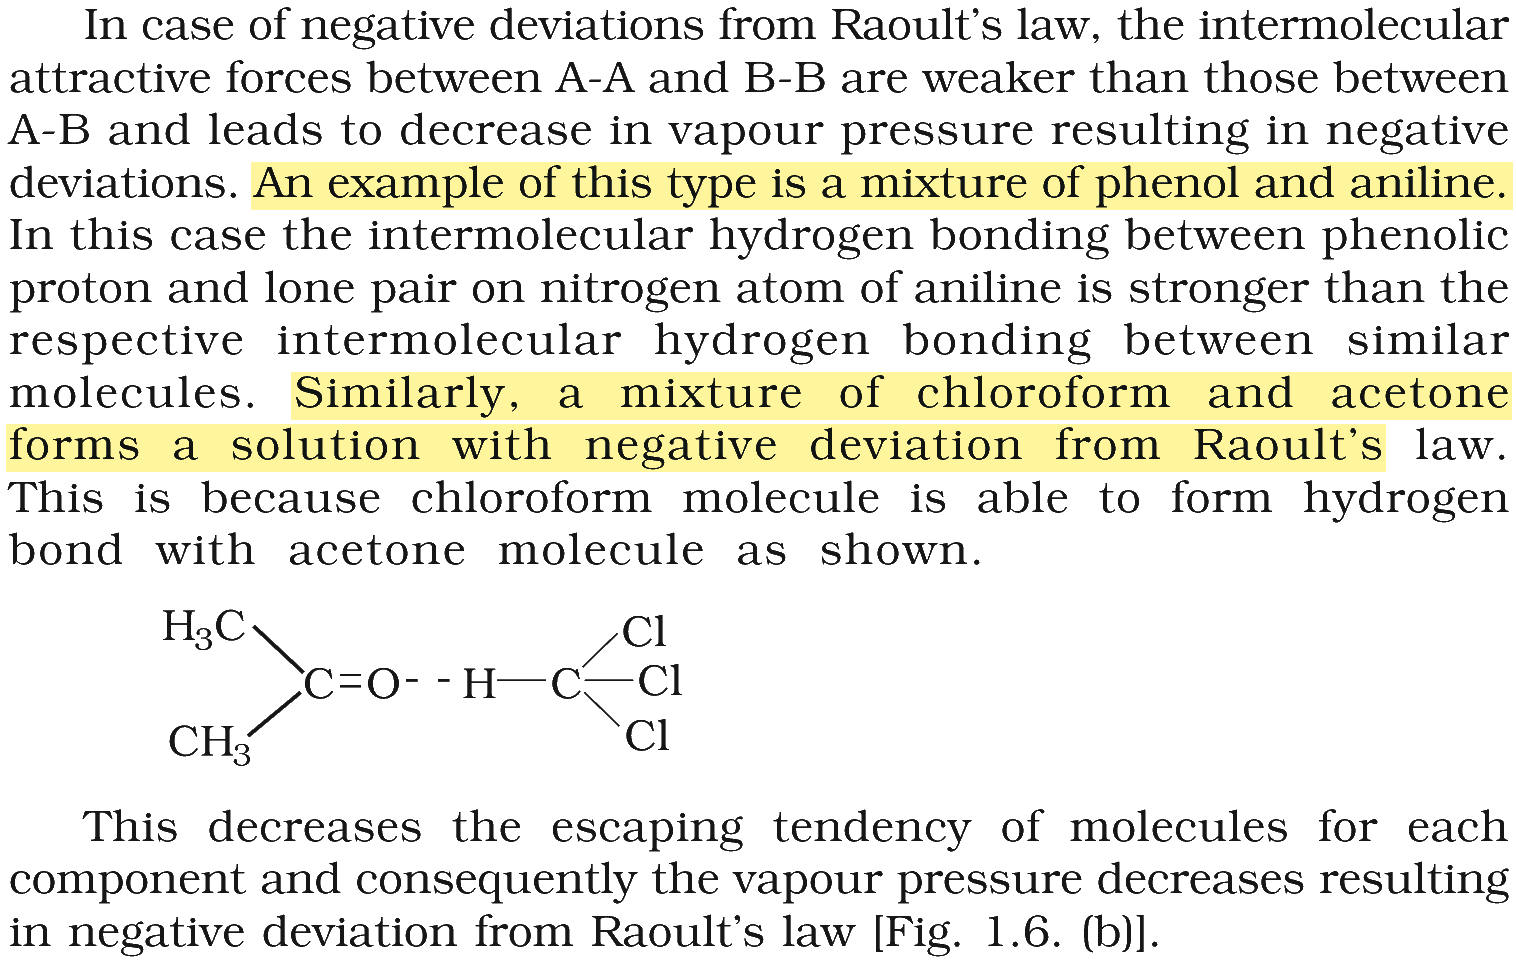
Negative deviation: A–B attractions are stronger, molecules escape less easily, and the vapour pressure is lower than the ideal line (e.g. chloroform + acetone, phenol + aniline).
In the given graph, the vapour pressure of the solution and both partial pressures lie below their dashed ideal lines, so it shows a negative deviation.
(A) Positive deviation from Raoult’s law. — Incorrect. In a positive deviation the curves would lie above the dashed lines.
(B) Negative deviation from Raoult’s law. — Correct. The vapour pressure of the solution is lower than that predicted by Raoult’s law.
(C) Chloroform and acetone. — Correct. The A–B hydrogen bond is stronger than the A–A and B–B attractions.
(D) Phenol and aniline. — Correct. Here too the A–B hydrogen bond is stronger, so the vapour pressure falls.
NCERT (2026-27 edition):
Non-ideal Solutions – …