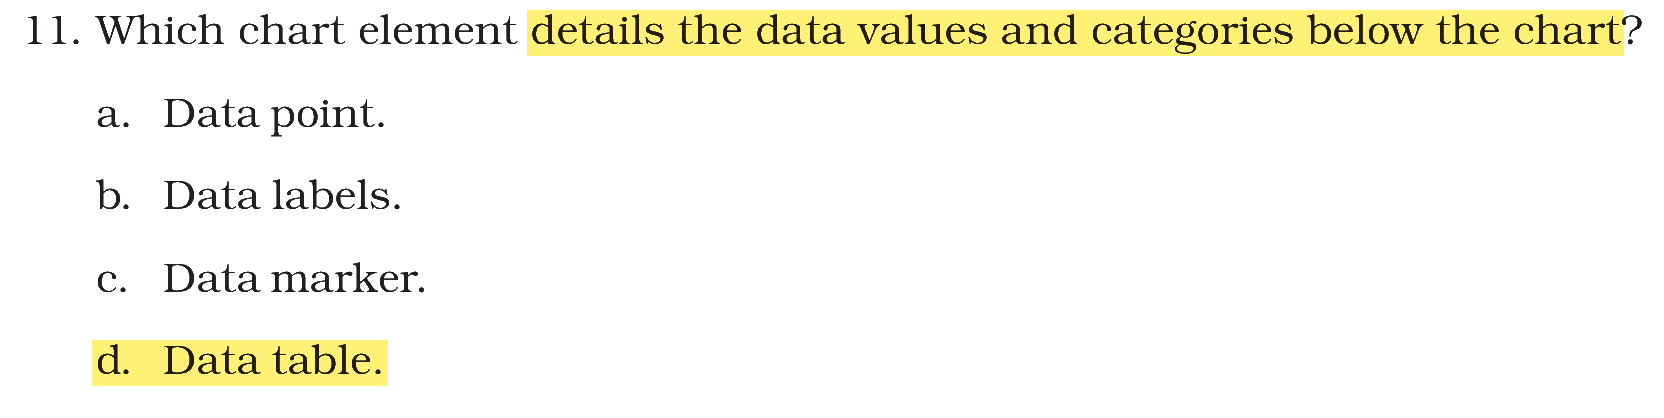
Which chart element gives details of the data values and also the categories below the chart?
Answer & explanation
Correct answer: option 1
The correct answer is Option (1) → Data Labels
Note: The given answer is as per the official NTA Answer Key. However, the answer given by NTA appears to be incorrect, and the correct answer should be Option (2), because a data table is the element shown below the chart, as explained below.
In an Excel chart, a data table is a grid placed below the chart that lists the values of each data series against the categories of the horizontal axis. Data labels, by contrast, are written on the bars, points or slices themselves.
Option (1) Data Labels — The answer given by NTA, but it seems to be incorrect. Data labels show values on the data points inside the plot area, not a list of values and categories below the chart.
Option (2) Data Table — Should be correct. It gives the data values together with the categories in a table below the chart.
Option (3) Data Marker — Incorrect. A marker is the bar, dot or slice that stands for one value.
Option (4) Data Point — Incorrect. A data point is a single value plotted in the chart.
The NCERT book’s own answer key also prints 11. b (Data labels), but the element described in the question is the data table; the key appears to be a misprint.
Advice for the exam: In the real exam, mark the answer that is correct as per accounting principles and the NCERT book. If NTA’s provisional answer key marks a different option, challenge it during the answer-key challenge window, giving proper reasoning. NTA does revise its key when a challenge is well justified, so a sound challenge can raise your marks.
NCERT (2026-27 edition):
NCERT (2026-27 edition):
|