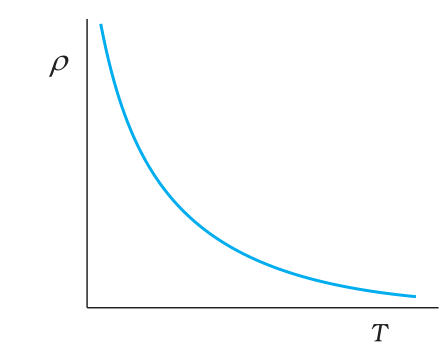
The graph showing variation of resistivity with temperature is for:
Answer & explanation
Correct answer: option 4
The correct answer is Option (4) → Silicon
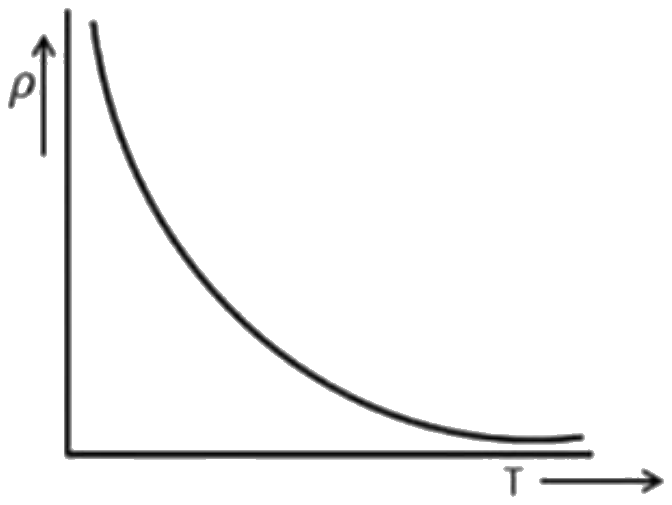
The graph shows resistivity decreasing with rise in temperature. This is the behaviour of a semiconductor.
In a semiconductor, heating breaks more covalent bonds and the number density of charge carriers \( n \) rises very quickly. This outweighs the small fall in relaxation time, so \( \rho = m/(ne^{2}\tau) \) decreases.
In metals such as aluminium, silver and iron, \( n \) is fixed and heating only shortens the relaxation time, so their resistivity increases with temperature (nearly linearly near room temperature).
Silicon is the only semiconductor among the options.
NCERT (2026-27):
Temperature Dependence of Resistivity – “… Unlike metals, the resistivities of semiconductors decrease with increasing temperatures. A typical dependence is shown in Fig. 3.10.”