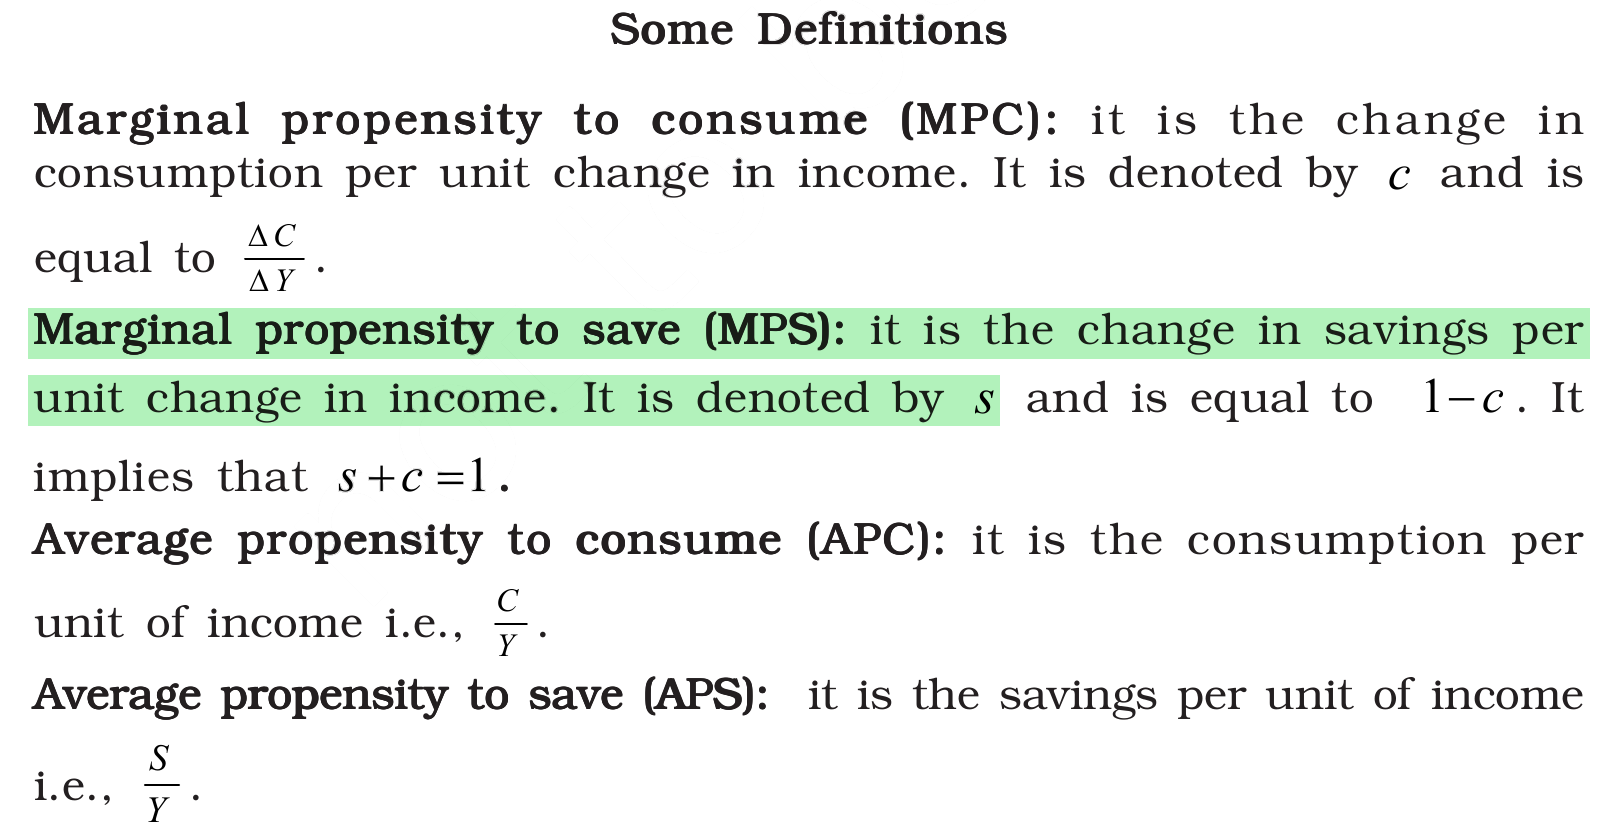
Which of the following depicts the actual meaning of marginal propensity to save (MPS)?
Answer & explanation
Correct answer: option 4
The correct answer is Option (4) → It is the change in savings per unit of change in income.
When people’s income rises, they consume a part of the increase and save the rest. The change in savings per unit of change in income, ΔS/ΔY, is the marginal propensity to save (MPS): if income rises by Rs 100 and saving by Rs 20, the MPS is 0.2.
Since every extra rupee is either consumed or saved, the MPS and the marginal propensity to consume add up to one: MPC + MPS = 1.
Why the other options are incorrect
Option (1) It is the savings per unit of income. — Incorrect. Saving per unit of income, S/Y, is the average propensity to save (APS), a ratio of totals and not of changes.
Option (2) It is the consumption per unit of income. — Incorrect. Consumption per unit of income, C/Y, is the average propensity to consume (APC).
Option (3) It is the change in consumption per unit change in income. — Incorrect. This is the marginal propensity to consume (MPC), ΔC/ΔY, the complement of MPS.
NCERT: Introductory Macroeconomics — Chapter 4: Determination of Income and Employment (2025-26)
|