CUET Preparation Today
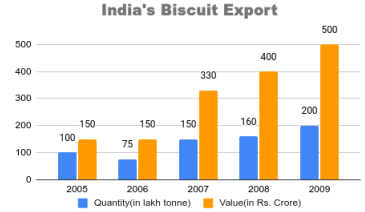
The given bar graph shows the biscuit exports of India over a period of five years. Study the graph and answer the question that follow.
In which two years was the value per tonne equal? |
2005 and 2006 2008 and 2009 2007 and 2008 2006 and 2007 |
2008 and 2009 |
Value per tonne in 2005 = \(\frac{150 }{100}\) = 1.5 Value per tonne in 2006 = \(\frac{150 }{75}\) = 2 Value per tonne in 2007 = \(\frac{330 }{150}\) = 2.2 Value per tonne in 2008 = \(\frac{400 }{160}\) = 2.5 Value per tonne in 2009 = \(\frac{500 }{200}\) = 2.5 So in 2008 and 2009 value per tonne is equal. Ans :- 2008 and 2009 |