CUET Preparation Today
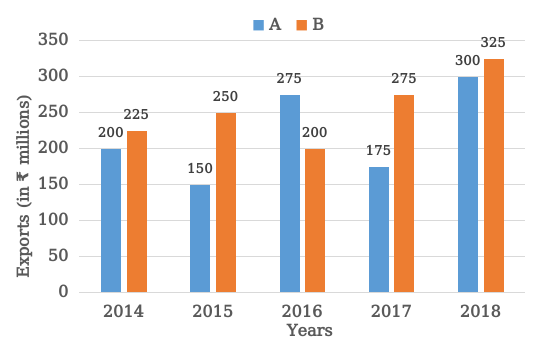
Study the given bar graph and answer the question that follows. The bar graph shows the exports of cars of type A and B (in ₹ millions) from 2014 to 2018.
The total exports of cars of type B from 2015 to 2018 is what percentage more than the total exports of cars of type A from 2015 to 2018 (correct to one decimal place)? |
17.2% 15.5% 14.9% 16.7% |
16.7% |
Total export of car of type B in 2015 to 2018 = 250 + 200 + 275 + 325 = 1050 Total export of car type of A in 2015 to 2018 = 150 + 275 + 175 + 300 = 900 Required percentage = \(\frac{150}{900}\) × 100 = 16.67% = 16.7% (correct to one decimal place) |