
The bar graph shows the production of sugar (in 1000 tonnes) by a company over six years, 2010 to 2015.
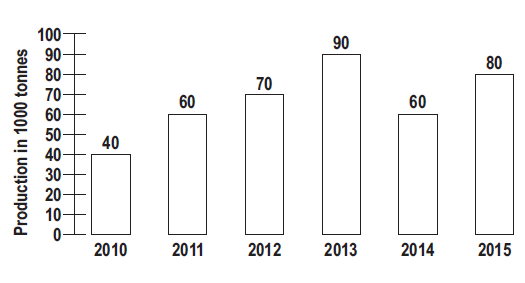
The production in 2015 is what percent of the total production in the other years?
Answer & explanation
Correct answer: option 4
The correct answer is Option (4) → 25%
The "other years" are 2010 to 2014, so their total is the base and the 2015 bar is taken as a percentage of it.
Production in 2015 = 80 thousand tonnes
Other years: \(40+60+70+90+60=320\) thousand tonnes
\(\displaystyle\frac{80}{320}\times100=25\%\)