CUET Preparation Today
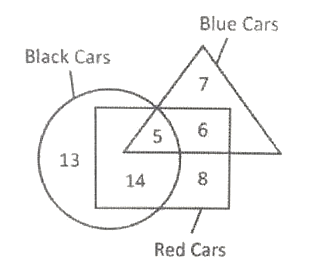
How many red cars are there?
|
31 22 28 33 |
33 |
BLACK CARS represents by Circle BLUE CARS represents by TRIANGLE RED CARS represents by SQUARE By visual representation we can conclude total red cars in the figure = 14 + 5 + 6 +8 = 33 |