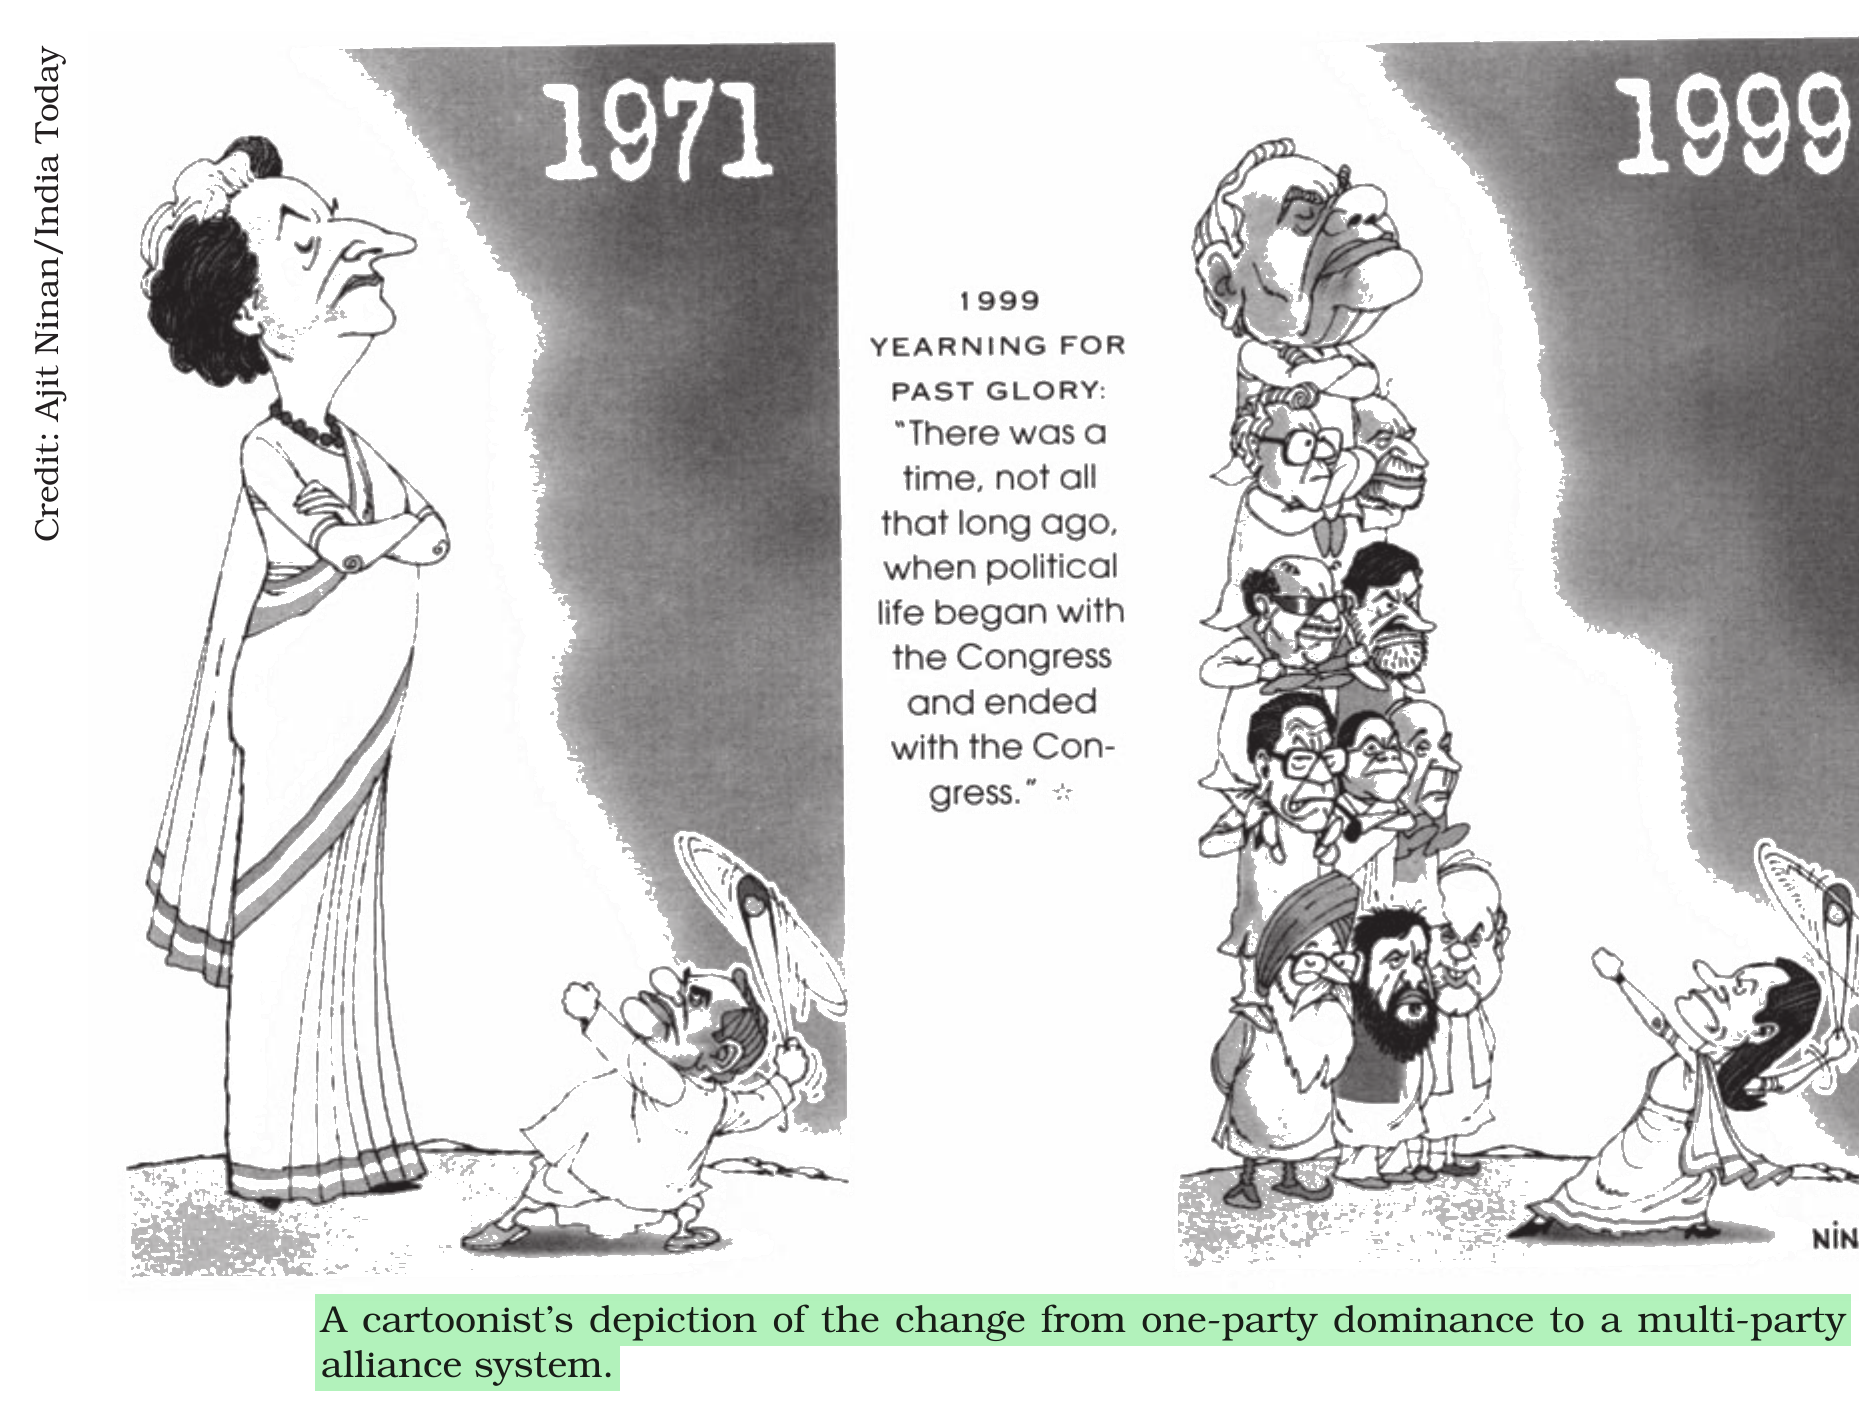
What can be the most suitable interpretation of the given cartoon?
Answer & explanation
Correct answer: option 1
The correct answer is Option (1) → Change from one party dominance to a multiparty alliance system
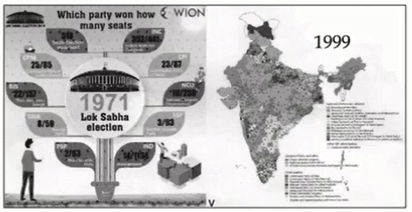
Option (1) Change from one party dominance to a multiparty alliance system — Correct. The picture sets the 1971 Lok Sabha election, in which the Congress won most of the seats, beside a map of 1999, in which many parties and alliances share the country. With the elections of 1989, a long phase of coalition politics began, and a government could be formed only with the support of many regional parties.
Option (2) Change from multi party alliance to one party dominance — Incorrect. The picture runs from 1971 to 1999, so the change goes the other way: from the dominance of one party to many parties in alliances.
Option (3) Co-operation between Govt. and Opposition — Incorrect.
Option (4) Strength in Unity — Incorrect.
NCERT (2026-27): “Alliance politics … Thus, with the elections of 1989, a long phase of coalition politics began in India. Since then, there have been eleven governments at the Centre, all of which have either been coalition governments or minority governments supported by other parties, which did not join the government. In this new phase, any government could be formed only with the participation or support of many regional parties. This applied to the National Front in 1989, the United Front in 1996 and 1997, the BJP-led coalition in 1998, the NDA in 1999, the UPA in 2004 and 2009.…”
|