CUET Preparation Today
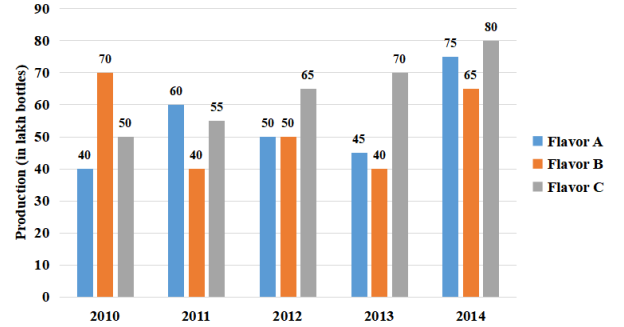
Study the given bar graph and answer the question that follows. A soft drink company prepares drinks of three different flavors A, B and C. The bar graph shows the production of three flavors over a period of five years from 2010 to 2014.
What percentage of the total production of soft drink of flavor A in 2013 and 2014 is the total production of soft drink of flavor B in 2011 and 2012? |
60% 70% 55% 75% |
75% |
Total production of A in 2013 and 2014 = 45 + 75 = 120 Total production of soft drink of flavor B in 2011 and 2012 =40 + 50 = 90 Required percentage = \(\frac{90 }{120}\) × 100 = \(\frac{3 }{4}\) × 100 = 75%
|