CUET Preparation Today
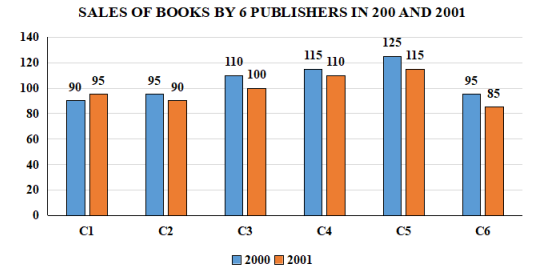
The following bar graph shows the sales (in thousands) of books from six different branches of a publishing company in 2000 and 2001.
Answer the following question based on the bar graph: What is the ratio of the total sales of C3 for both years to the total sales of C4 for both years? |
14 : 15 12 : 13 13 : 14 15 : 14 |
14 : 15 |
Total sale of C3 : Total sale of C4 (110 + 100) : (115 + 110) 210 : 225 14 : 15 |