CUET Preparation Today
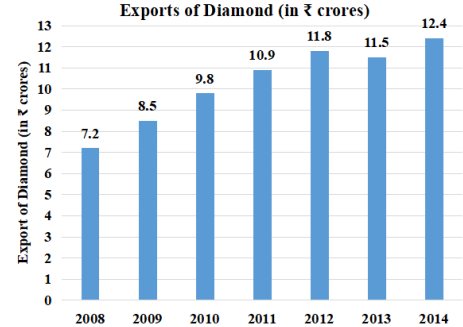
Study the following bar graph and answer the question that follows.
In how many years was the export more than the average for the given period? |
6 4 5 3 |
4 |
Average export = \(\frac{7.2+8.5+9.8+10.9+11.8+11.5+12.4 }{7}\) = \(\frac{ 72.1 }{7}\) = 10.3 Export in year 2008 , 2009 & 2010 is less than average export i.e. 10.3. Ans :- 3 |