
CUETMOCK
  • Pricing
  • Mentors
Log inStart freeStart free mocks→

First test, then trust

Try a free CUET mock test.

Join 5,00,000+ students who rehearsed exam day on the exact NTA screen before sitting CUET. On the web and on Android.

Start free mocks →Get the Android app
CUETMOCK

India's #1 CUET Mock Test Platform. Original NCERT-based questions on the exact NTA exam screen — trusted by 5,00,000+ students since CUET 2022.

Get it onGoogle PlayScan to download the CUETMOCK app

Mock tests

  • CUET mock test series
  • Commerce mocks
  • Humanities (Arts) mocks
  • Science mocks
  • Languages & GAT mocks
  • Free practice questions
  • Pricing

Resources

  • CUET exam guide
  • CUET syllabus
  • Universities accepting CUET
  • Expert blogs
  • News & notifications
  • Webinars & counselling
  • CUET score calculator
  • How we estimate your rank
  • FAQs

Company

  • About us
  • Our leadership & team
  • Our toppers
  • Mentors
  • For schools
  • Contact us
  • Terms
  • Privacy
  • Refund policy

Talk to us

+91 7696 6630 56info@cuetmock.comWhatsApp us

Our other platforms

  • JEE Mock — For IIT-JEE aspirants
  • NEET Mock — For NEET aspirants

Newsletter

Exam updates, study material and offers — no spam.

© 2026 NYC Ventures Pvt. Ltd.

701-702, Royal Business Park, Zirakpur, Punjab - 140603

  • Terms of use
  • Privacy policy
  • Refund policy
  • Contact us

iCUETMOCK is an independent preparation platform, not affiliated with the National Testing Agency (NTA). Always check exam details on the official NTA website.

  • Home
  • Mock tests
  • CUET guide
  • Pricing
  • Log in
Home/Practice questions/Biology
BiologyEvolution

The graph given below shows how the distribution of a trait in a popu…

Read the given passage and answer the questions that follow :-
In a given population one can find out the frequency of occurrence of alleles of a gene or a locus. This frequency is supposed to remain fixed and even remain the same through generations. Hardy-Weinberg principle stated it using algebraic equations. This principle says that allele frequencies in a population are stable and is constant from generation to generation. The gene pool remains a constant. This is called genetic equilibrium.

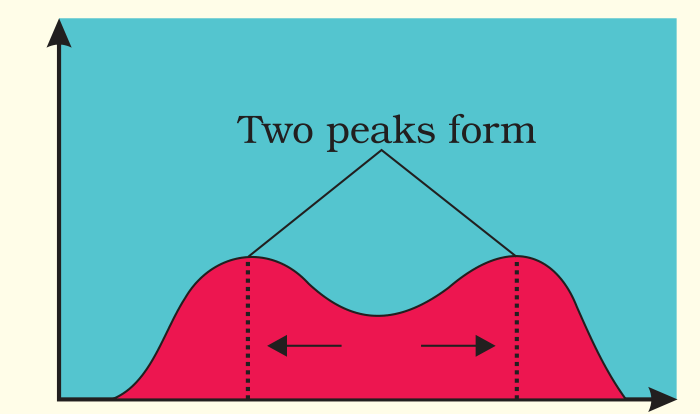
The graph given below shows how the distribution of a trait in a population has changed. Which of the following does it show?
Graph

Answer & explanation+

Correct answer: option 1

The correct answer is Option (1) → Disruptive selection

Natural selection can change the spread of a trait in a population in three ways. In the graph the single peak has given way to two peaks at the two ends of the curve, with fewer individuals in the middle. This means more individuals now carry peripheral character values at both ends of the distribution.

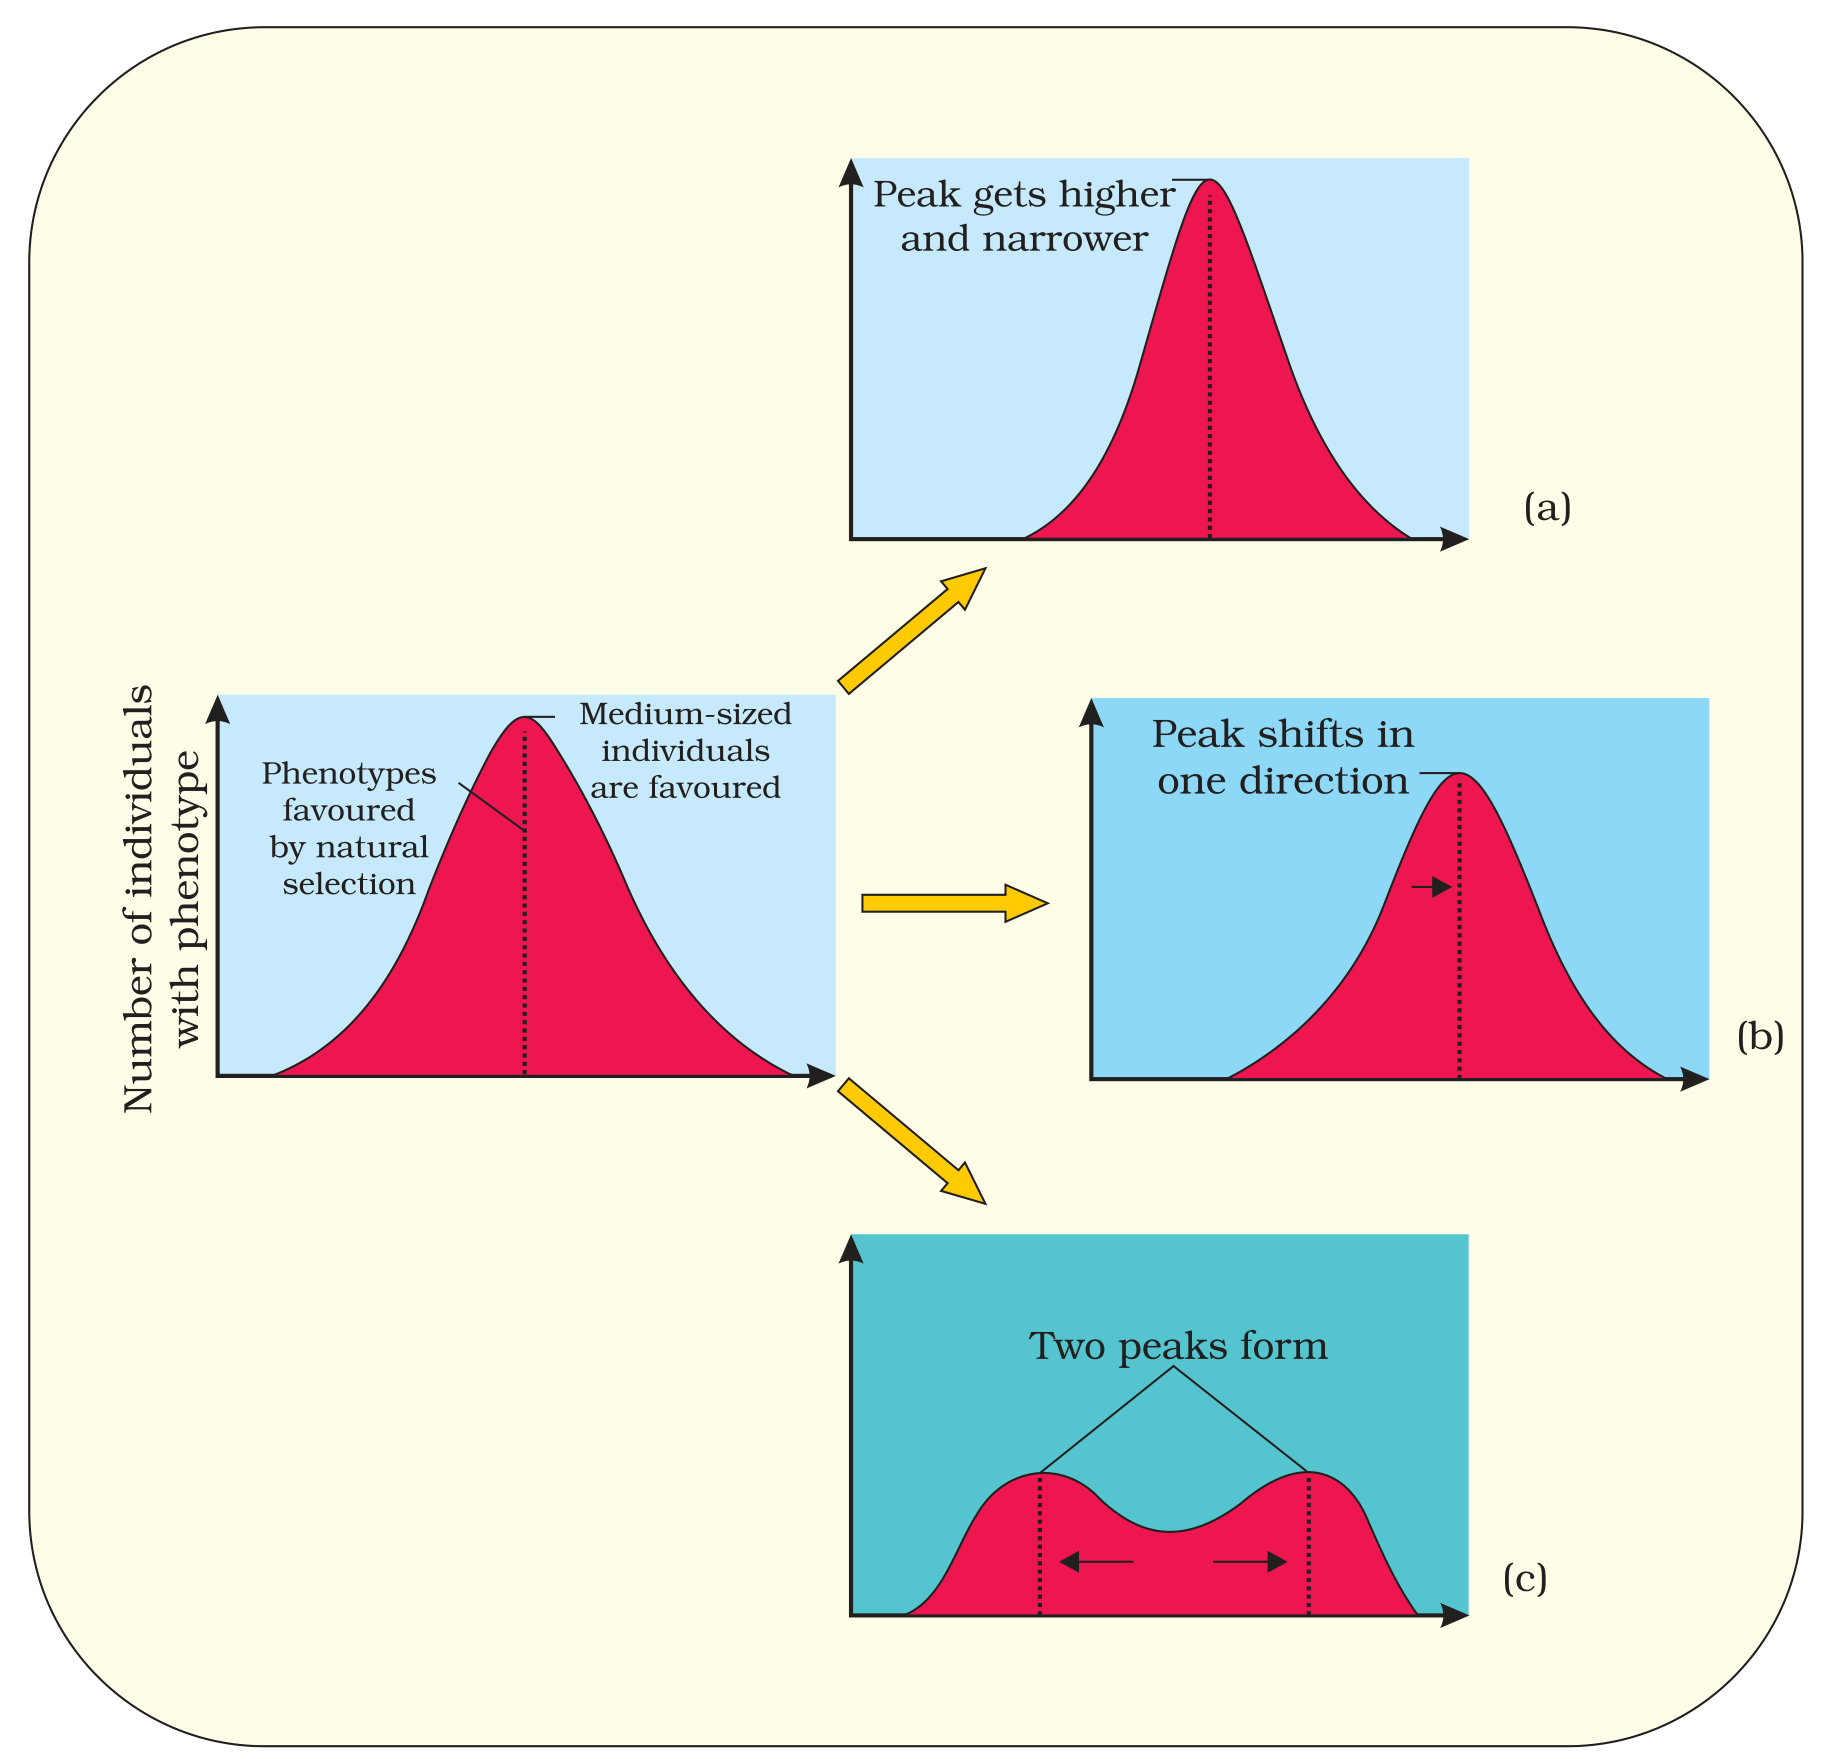
Option (1) Disruptive selection — Correct. Disruptive selection favours both extremes, so two peaks form, as in Figure 6.8(c).

Option (2) Directional selection — Incorrect. In directional selection the single peak shifts in one direction, because more individuals acquire a value other than the mean.

Option (3) Stabilising selection — Incorrect. In stabilising selection more individuals acquire the mean value, so the single peak gets higher and narrower.

Option (4) Genetic drift — Incorrect. Genetic drift is a chance change in allele frequencies. It is not one of the three patterns of selection drawn in this figure.

Note: Figure 6.8 packs three kinds of selection into three small graphs, and a single panel of it was enough for this question. Learn the shape of each curve along with its name.

NCERT Extract:
Hardy-Weinberg Principle – “… Coupled to enhance reproductive success, natural selection makes it look like different population. Natural selection can lead to stabilisation (in which more individuals acquire mean character value), directional change (more individuals acquire value other than the mean character value) or disruption (more individuals acquire peripheral character value at both ends of the distribution curve) (Figure 6.8).”
Textbook figure

Figure 6.8 Diagrammatic representation of the operation of natural selection on different traits : (a) Stabilising (b) Directional and (c) Disruptive

Advertisement

Practise more on Evolution

Chapter-wise mocks on the real NTA exam screen, with solutions and your rank. Your first mocks are free.

Start free mocks →

Advertisement

Next questions

  1. Which Article of the Constitution of India provides for equal justice and free legal aid?Legal Studies · Arbitration, Tribunal Adjudication and Alternate Dispute resolution
  2. Which of the following is not a characteristic of a good brand name?Business Studies · Marketing
  3. Match the following : COLUMN I : Components COLUMN II : Symbols A Switch 1 B Electric Bulb 2 C Battery 3 D Resistor 4General Aptitude Test · General Knowledge
  4. Laldenga was the leader of:Political Science · Politics in India Since Independence: Regional Aspirations
  5. Which of the following is NOT an institutional investor?Entrepreneurship · Resource Mobilisation
  6. The National Budget of 2023 has listed seven priorities i.e. Saptarishi. Which of the following is NOT a seven priorities listed in the bud…General Aptitude Test · Current Affairs
  7. All those elements which create liability and decrease the assets of government are known as:Economics · Macro Economics: Government Budget and Economy
  8. What should be the period of rotation of earth so as to make any object on the equator weigh half of its present value?Physics · Gravitation
  9. Consider the following statement related to investment:(A) The common notion is that investment is using money to buy physical or financial…Economics · Macro Economics: National Income Accounting
  10. Two astronomical telescopes P and Q have objective lenses of the same focal length. The objective of P has a diameter of 20 cm and that of…Physics · Ray Optics