CUET Preparation Today
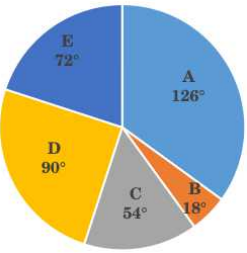
Study the given pie chart and answer the question that follows. The pie chart shows the breakup of the total number of employees of a company working in different offices (A to E), in degrees. The total number of employees = 3600.
If the percentage of male employees in office C is 20% and that of female employees in office D is 40%, then what is the ratio of the number of female employees in office D to tat of female employees in office C? |
3 : 8 2 : 3 3 : 2 5 : 6 |
5 : 6 |
40% = \(\frac{2}{5}\) & 20% = \(\frac{1}{5}\) Total employee of C = \(\frac{54}{360}\) × 3600 = 540 Total employee of D = \(\frac{90}{360}\) × 3600 = 900 Female employee in D : Female employee in C \(\frac{2}{5}\) × 900 : \(\frac{4}{5}\) × 540 5 : 6 Total employee of C = \(\frac{54}{360}\) × 3600 = 540 |