CUET Preparation Today
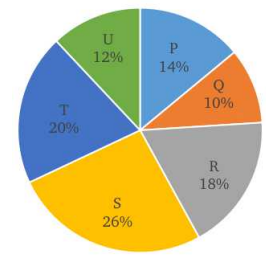
The following pie chart describes the sales of a particular brand of T-shirts in 6 of their outlets P, Q, R, S, T and U. The total sales in which two given outlets exceed the sales in the outlet S?
|
P and U R and U Q and U P and Q |
R and U |
Lets solve one by one for each option , Sale of S = 26% 1. P and U Total sale of P & U = 14% + 12% = 26% 2. R and U Total sale of R & U = 18% + 12% = 30% 3. Q and U Total sale of Q & U = 10% + 12% = 22% 4. P and Q Total sale of P & Q = 14% + 10% = 24% So , Combined sale of R and U is more than sale of S. |