CUET Preparation Today
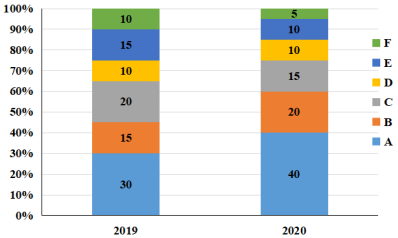
The following bar graph shows the production of various models of mobiles in the year 2019 and 2020. The total production is 40 lakhs during 2019 and 65 lakhs in 2020.
What is the total production of model A mobiles in 2020 and model E mobiles in 2019? |
39,00,000 32,00,000 36,00,000 21,00,000 |
32,00,000 |
Sum of model A in 2020 and model E in 2019 = \(\frac{40}{100}\) × 65 + \(\frac{15}{100}\) × 40 = \(\frac{2}{5}\) × 65 + \(\frac{3}{20}\) × 40 = 26 + 6 = 32 lakh = 32,00,000 |