CUET Preparation Today
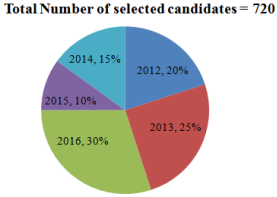
The Pie-chart given here shows the percentage of candidates selected in an Examination from 2012 to 2016.
Total number of candidates selected in 2012 and 2014 together is: |
250 180 252 144 |
252 |
Total number of selected candidates = 720 Number of candidates selected in 2012 & 2014 = \(\frac{20+15 }{100}\) × 720 = \(\frac{7 }{20}\) × 720 = 252
|