CUET Preparation Today
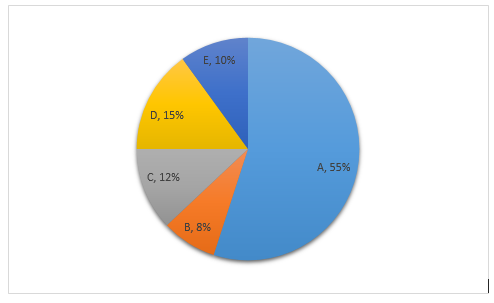
Study the following pie-chart and answer the given question. The pie-chart shows the Budget Expenditure of a company in the year 2018 (percentage distribution) on different heads A, B, C, D & E.
The central angle of the sector representing expenditure on head D is: |
45° 52° 56° 54° |
54° |
Central angle of the sector representing expenditure on head D = \(\frac{15 }{100 }\) × 360° = \(\frac{3 }{20 }\) × 360° = 54° |