
The graph between the frequency of incident light and the stopping potential is a -
Answer & explanation
Correct answer: option 2
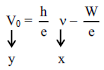
y = mx – c (straight line).
The graph between the frequency of incident light and the stopping potential is a -
Correct answer: option 2
y = mx – c (straight line).