CUET Preparation Today
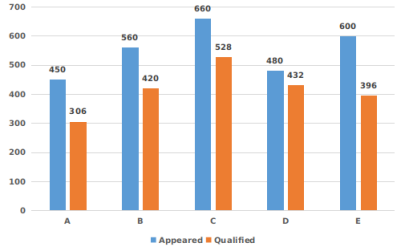
The following graph shows the data of the number of candidates that appeared and qualified for a competitive exam from the colleges A, B, C, D, E.
Based on the information, the difference between the percentage of students that qualified, from the colleges B and D is: |
20 18 12 15 |
15 |
In case of B , Total appeared students = 560 Qualified students = 420 Percentage of Qualified students = \(\frac{420 }{560}\) × 100 = 75% In case of D , Total appeared students = 480 Qualified students = 432 Percentage of Qualified students = \(\frac{432 }{480}\) × 100 = 90% Difference in percentage of qualified students from B and D = 90% - 75% = 15% |