CUET Preparation Today
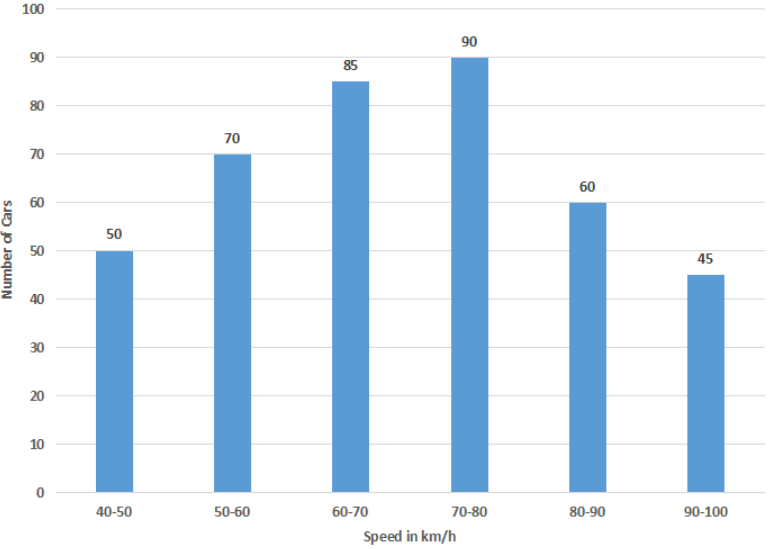
The given histogram shows the frequency distribution of the speed of cars passing though at a particular spot on a highway. Study the graph and answer the question that follows.
What percentage of cars were running with speed less than 70 km/h? |
45.75% 60% 30% 51.25% |
51.25% |
Total number of cars = 50 + 70 + 85 + 90 + 60 + 45 = 400 Percentage of Cars with speed less than 70 km/h = \(\frac{50 + 70 + 85}{400}\) × 100 = \(\frac{205}{400}\) × 100 = 51.25% |