CUET Preparation Today
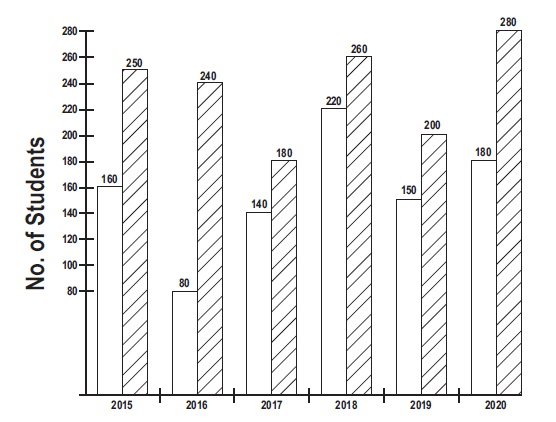
The following bar chart shows the no. of college students enrolled in two summer camps A and B from 2015 to 2020. Blank Bars = A Line Bars = B
The no. of students enrolled in camp A in 2015 and 2017 together is what percentage of no. of students enrolled in camp B in 2015 and 2019? |
33.33% 66.66% 77.88% 88.9% |
66.66% |
No. of students in camp A in 2015 and 2017 = 160 + 140 = 300 No. of students in camp B in 2015 and 2019 = 250 + 200 = 450 Required percentage = \(\frac{300}{450}\) × 100 = \(\frac{200}{3}\) = 66.66% |