CUET Preparation Today
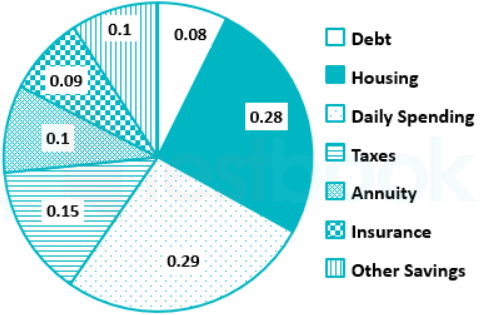
The Pie chart given below presents the figures of different heads of expenditure made in a year by Anurag. On how many heads is his expenditure less than what he had spent on taxes?
|
2 1 4 3 |
4 |
Expenditure on taxes = 0.15 By carefully observing the pie chart . We find that , There are 4 heads Annuity , Insurance , Debt & other savings in which expenditure is less than taxes. Ans :- 4 |