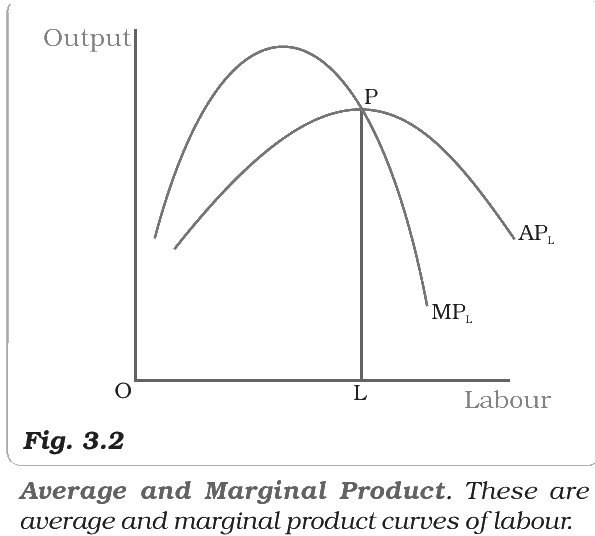
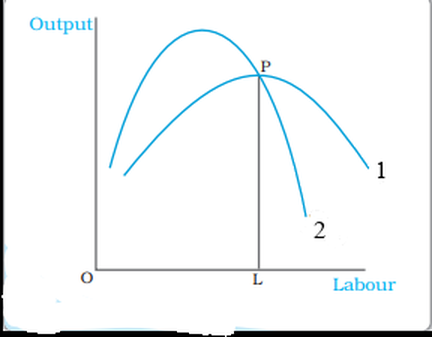
In the following figure, labour is on the X-axis and output on the Y-axis. Which curve is marked 2?
Answer & explanation
Correct answer: option 1
The correct answer is Option (1) → Marginal Product
Curve 2 rises faster, reaches its top earlier, then cuts the other curve at that curve’s highest point from above and falls below it. Only the MP curve behaves like this: it cuts the AP curve from above at the maximum of AP.
Option (1) Marginal Product — Correct. MP is above AP while AP rises and below AP once AP falls.
Option (2) Average Product — Incorrect. AP is the curve that curve 2 cuts at its top. AP rises less than MP and falls more slowly.
Option (3) Total Product — Incorrect. The TP curve keeps rising as labour rises. It does not cut the AP curve at the top of AP.
Option (4) Marginal Utility — Incorrect. Marginal utility belongs to consumer behaviour.
NCERT (2026-27): “3.5 Shapes of Total Product, Marginal Product and Average Product Curves … Figure 3.2 shows the shapes of AP and MP curves for a typical firm. The AP of factor 1 is maximum at L. To the left of L, AP is rising and MP is greater than AP. To the right of L, AP is falling and MP is less than AP.” “3.5 Shapes of Total Product, Marginal Product and Average Product Curves … As long as the AP increases, it must be the case that MP is greater than AP. Otherwise, AP cannot rise. Similarly, when AP falls, MP has to be less than AP. It, follows that MP curve cuts AP curve from above at its maximum.”
|