CUET Preparation Today
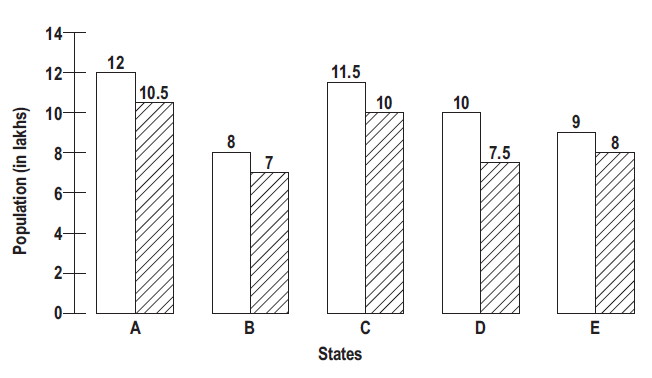
The following bar graph shows the number of youth (in lakhs) and the number of employed youth (in lakhs) in five states A, B, C, D and E. Blank Bars = Youth Line Bars = Employed Youth
Which state has employed youth between 70-80% of its total youth population? |
A C D E |
D |
The percentage of employed youth in state A = \(\frac{10.5}{12}\) × 100% = 87.5% The percentage of employed youth in state B = \(\frac{7}{8}\) × 100% = 87.5% The percentage of employed youth in state C = \(\frac{10}{11.5}\) × 100% = 86.95% The percentage of employed youth in state D = \(\frac{7.5}{10}\) × 100% = 75% ← The percentage of employed youth in state E = \(\frac{8}{9}\) × 100% = 88.88%
|