CUET Preparation Today
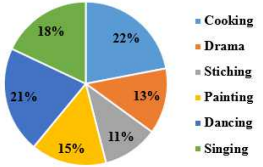
The given pie chart shows the percentage of students who enrolled in different bobby classes in a school. The number of students who enrolled in cooking classes is what percentage of those enrolled in dancing classes? (Rounded off to 2 digits after decimal).
|
92.65% 125.25% 105.56% 104.76% |
104.76% |
Required percentage = \(\frac{22}{21}\) × 100 = 104.76% |