
The figure shows the circular flow of income in a simple economy. Arrows 1 and 2 are labelled; arrows 3 and 4 are not.
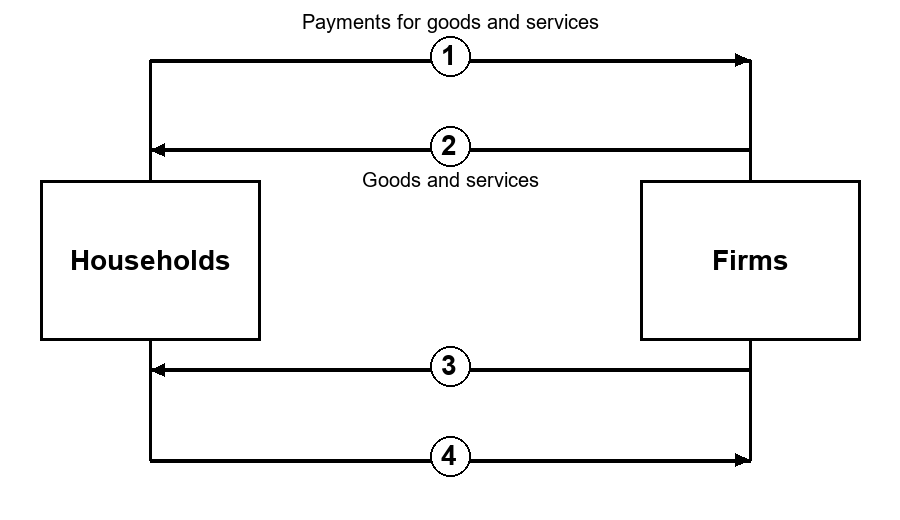
Which arrow shows the services that households render to firms?
Answer & explanation
Correct answer: option 4
The correct answer is Option (4) → Arrow 4
In the circular flow, the two lower arrows show the market for factors of production. The lowest arrow, from households to firms, shows the services households render to firms. In the figure that is Arrow 4.
Arrow 3, just above it, runs from firms to households: the payments firms make for these services.
NCERT (2026-27): “2.2 Circular Flow of Income and Methods of Calculating National Income … The two arrows at the bottom of the diagram similarly represent the factors of production market. The lower most arrow going from the households to the firms symbolises the services that the households are rendering to the firms. Using these services the firms are manufacturing the output. The arrow above this, going from the firms to the households, represents the payments made by the firms to the households for the services provided by the latter. …” |