CUET Preparation Today
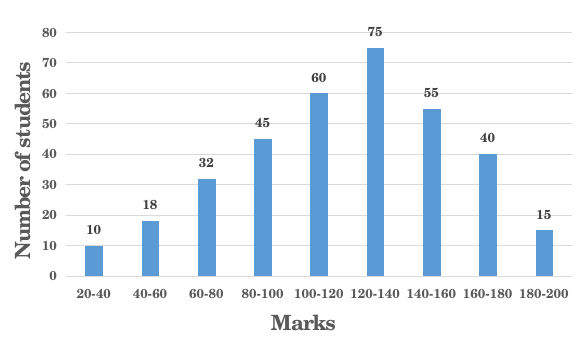
The given histogram represents the marks of students in Mathematics test of a certain class. The total number of students is 350 and the maximum marks of the test are 200. Study the graph and answer the question that follows.
The total number of students whose marks are less than 100 is what percentage (correct up to one place of decimal) less than the total number of students whose marks are 120 and above? |
32.7% 36.6% 43.2% 51.8% |
43.2% |
total number of students whose marks are less than 100 = 10 + 18 + 32 + 45 = 105 total number of students whose marks are 120 and above = 75 + 55 + 40 + 15 = 185 Required percentage = \(\frac{185 - 105}{185}\) × 100 = \(\frac{80}{185}\) × 100 = 43.2% |