CUET Preparation Today
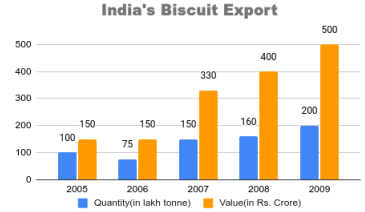
The given bar graph shows the biscuit exports of India over a period of five years. Study the graph and answer the question that follow.
In which year, the percentage increase in exports was maximum from its preceding year: |
2009 2006 2008 2007 |
2007 |
Lets solve one by one for each option. 1. 2009 Export in 2008 = 400 Export in 2009 = 500 Percentage increase in exports from its preceding year in 2009 = \(\frac{500-400 }{400}\) × 100 = \(\frac{100 }{400}\) × 100 = 25% 2. 2006 There is decrease in export in 2006 comparative to 2005. 3. 2008 Export in 2007 = 400 Export in 2008 = 500 Percentage increase in exports from its preceding year in 2008 = \(\frac{500-400 }{400}\) × 100 = \(\frac{100 }{400}\) × 100 = 25% 4. 2007 Export in 2006 = 75 Export in 2007 = 150 Percentage increase in exports from its preceding year in 2007 = \(\frac{150-75 }{75}\) × 100 = \(\frac{75 }{75}\) × 100 = 100% So , Percentage increase in exports from its preceding year in 2007 |