
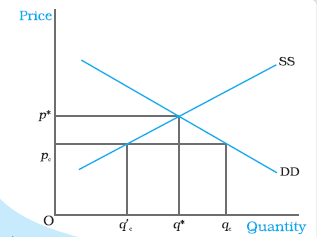
Which of the following is depicted by the graph above?
Answer & explanation
Correct answer: option 1
The correct answer is Option (1) → Price ceiling
The graph shows a price pc fixed below the equilibrium price p*. At pc buyers want qc but sellers offer only q′c, so there is excess demand. A government limit below p* is a price ceiling.
A price floor would be drawn above p* and would give excess supply. With free entry and exit, the graph would show a horizontal line at minimum average cost.
NCERT (2026-27): “5.2.1 Price Ceiling It is not very uncommon to come across instances where government fixes a maximum allowable price for certain goods. The government-imposed upper limit on the price of a good or service is called price ceiling. Price ceiling is generally imposed on necessary items like wheat, rice, kerosene, sugar and it is fixed below the market-determined price since at the market-determined price some section of the population will not be able to afford these goods.” “5.2.1 Price Ceiling … When the government imposes price ceiling at pc which is lower than the equilibrium price level, there will be an excess demand for wheat in the market at that price. The consumers demand qc kilograms of wheat whereas the firms supply q′c kilograms. …” |