
Study the graph given below, which shows the short run cost curves of a firm, and answer the questions that follow.
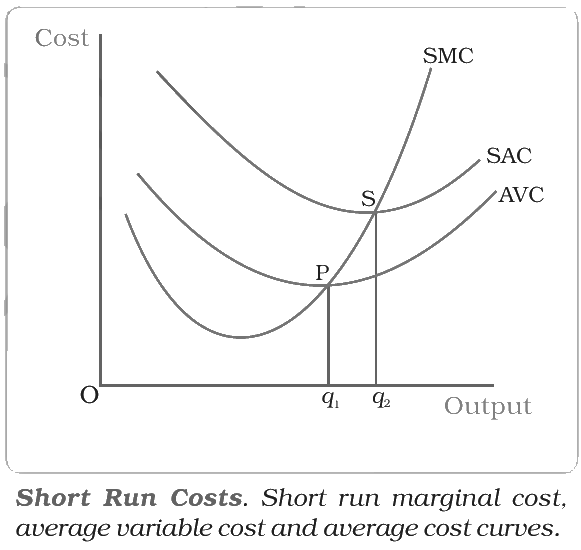
In the graph, what does the vertical distance between the SAC curve and the AVC curve at any level of output measure?
Answer & explanation
Correct answer: option 2
The correct answer is Option (2) → Average fixed cost
SAC is AVC plus AFC. So at any output, the vertical gap between the SAC curve and the AVC curve is the average fixed cost.
Option (1) Short run marginal cost — Incorrect. SMC is the cost of one extra unit of output. It has its own curve in the graph.
Option (2) Average fixed cost — Correct. SAC − AVC = AFC.
Option (3) Total fixed cost — Incorrect. TFC is a total, while SAC and AVC are costs per unit. The gap is TFC divided by output, which is AFC.
Option (4) Total variable cost — Incorrect. TVC is also a total: AVC multiplied by output. It is shown by an area.
NCERT (2026-27): “Shapes of the Short Run Cost Curves … Let us now look at SAC. SAC is the sum of AVC and AFC. Initially, both AVC and AFC decrease as output increases. Therefore, SAC initially falls. After a certain level of output production, AVC starts rising, but AFC continuous to fall. Initially the fall in AFC is greater than the rise in AVC and SAC is still falling. But, after a certain level of production, rise in AVC becomes larger than the fall in AFC. From this point onwards, SAC is rising. SAC curve is therefore ‘U’-shaped. It lies above the AVC curve with the vertical difference being equal to the value of AFC. The minimum point of SAC curve lies to the right of the minimum point of AVC curve.” |