CUET Preparation Today
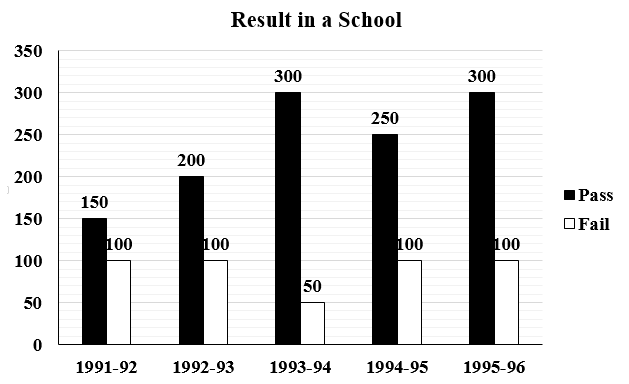
The following graph shows the results of students in a school.
In which years is the difference in number of students who passed to those who failed maximum? |
1991 - 92 1993 - 94 1992 - 93 1994 - 95 |
1993 - 94 |
Difference in passed to failed students in 1991 - 1992 = 150 - 100 = 50 Difference in passed to failed students in 1992 - 1993 = 200 - 100 = 100 Difference in passed to failed students in 1993 - 1994 = 300 - 50 = 250 Difference in passed to failed students in 1994 - 1995 = 250 - 100 = 150 Difference in passed to failed students in 1995 - 1996 = 300 - 100 = 200
Difference is maximum in 1993 - 1994
|