CUET Preparation Today
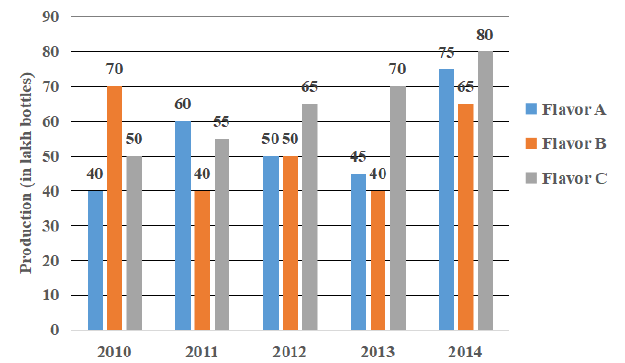
Cough syrup of three different flavors - A, B and C(in lakh bottles) manufactured by a medicine company over a period of five years from 2010 to 2014 has been shown in the bar graph.
The ratio of the average production of all flavors in 2012 to the difference of the average production of flavor A in 2012, 2013 and 2014 and the average production of flavor C in 2012. 2013 and 2014 is: |
3 : 11 11 : 3 15 : 26 26 : 15 |
11 : 3 |
Average production of all the flavors in year 2012 = \(\frac{50 + 50 + 65}{3}\) = \(\frac{165}{3}\) = 55 Average production of flavor A in 2012 , 2013 & 2014 = \(\frac{50 + 45 + 75}{3}\) = \(\frac{170}{3}\) ---(1) Average production of flavor C in 2012. 2013 and 2014 = \(\frac{65 + 70 + 80 }{3}\) = \(\frac{215}{3}\) -----(2) Difference b/w 1 & 2 = \(\frac{215}{3}\) - \(\frac{170}{3}\) = 15 Required ratio , 55 : 15 11 : 3 |