CUET Preparation Today
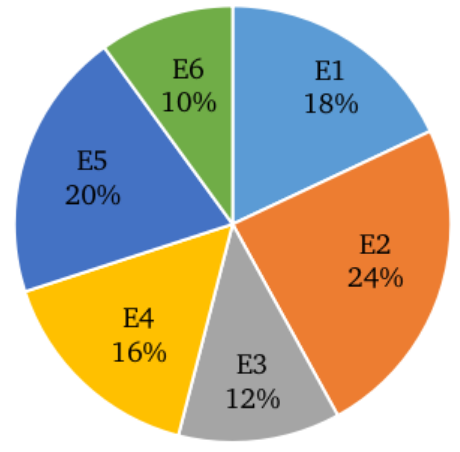
The following pie chart shows the number of leaves taken during a year by each of 6 different employees as percentages of the total number of leaves taken by these 6 employees, added together.
If the difference between the numbers of leaves taken by E2 and E5 is 14, then what is the total number of leaves taken during the year by all the 6 employees, added together? |
380 350 320 360 |
350 |
Difference b/w leaves of E2 and E5 = (24% - 20%) of total number of leaves = 4% of total number of leaves ATQ , 4% of total number of leaves = 14 Total number of leaves = \(\frac{100 }{4}\) × 14 = 25 × 14 = 350 |